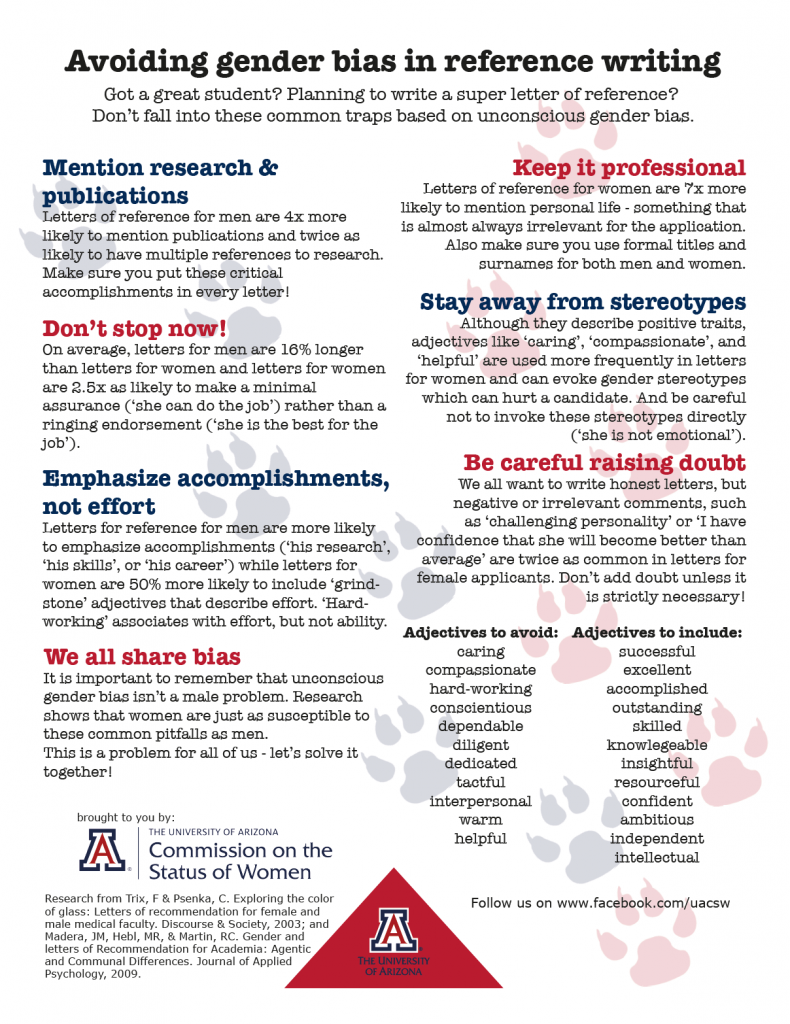
Download this resource from the University of Arizona.

Download this resource from the University of Arizona.
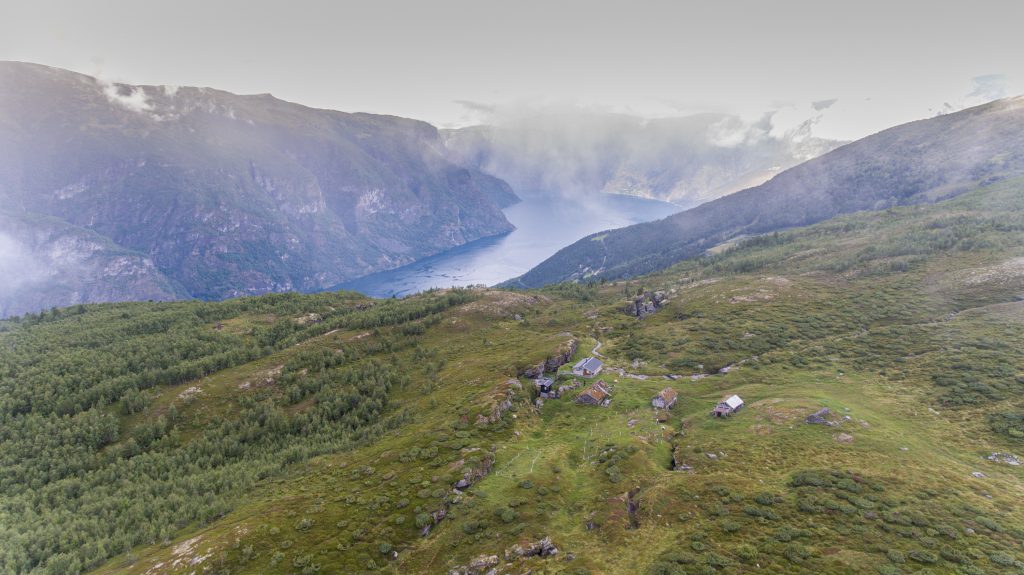
This summer has passed quickly with lot’s of field work setting up the Three-D project. We have selected plots, recorded vegetation and taken soil samples. The weather has been fantastic to do all the work this year (a bit unusual for Western Norway).
This week, we transplanted vegetation turfs from the mountain to lower elevation, which is part of the warmer climate treatment. From each site, we dug out 40 turfs (50 x 50 cm), put them in boxes and transported them 400m down the mountain, where they were put back into the ground. Each turf weighed between 10 – 30 kg and the 80 turfs must have added up to c. 2 tons. Luckily, we did not have to carry the turfs ourselves, we used a helicopter.
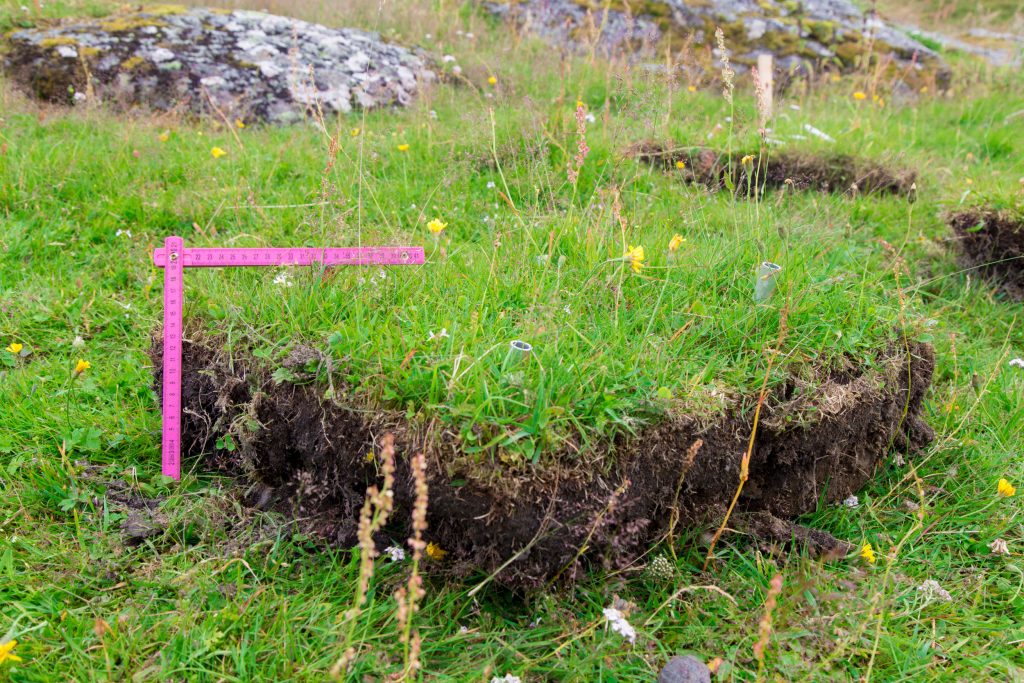
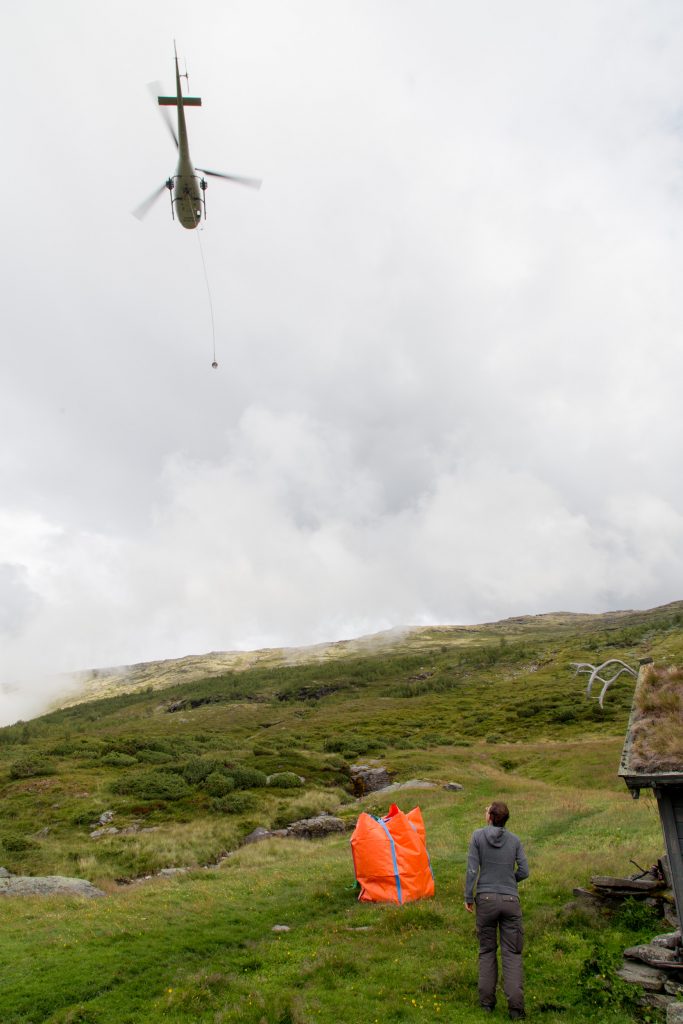
The organization of the transplanting has been a logistic nightmare and I am very glad it is done now. The helicopter cannot fly in fog or when there are strong winds. And I needed many helpers to dig out, be in several locations at the same time, coordinate the helicopter, put the turfs back into the soil.
Thanks again Josh, Vincent, Frida and Kevin for your hard work and high spirits! And thanks Kevin for filming, droning and taking nice shots!
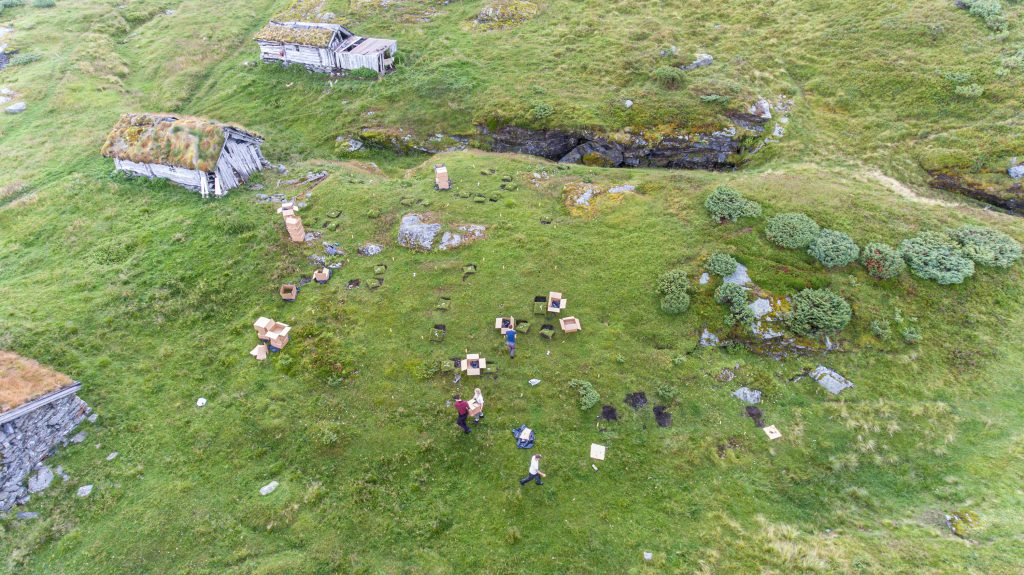
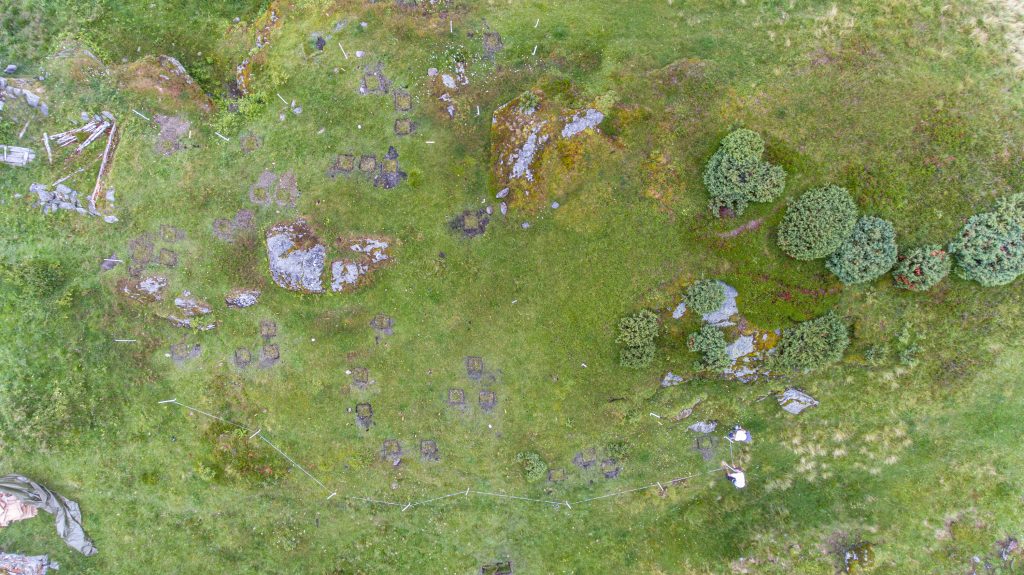
In the last two weeks I have travelled around the world (yes, I had to write this line) to select sites for the Three-D project in China and in Norway. We have successfully selected beautiful, species rich, and semi-natural grasslands along elevational gradients.
In each country we selected 3 sites along a productivity gradient. The gradient in Norway starts at 500m and stretches up to 1300m. In China, the lowest site is located at 3500m and the highest site at 4300m. The highest sites are low productive.
Both systems are grazed by somewhat different animals. In Norway, there are mainly sheep and goats, while in China, the dominant grazers are horses and yak.
The next step will be to select the plots and blocks and set up fences.
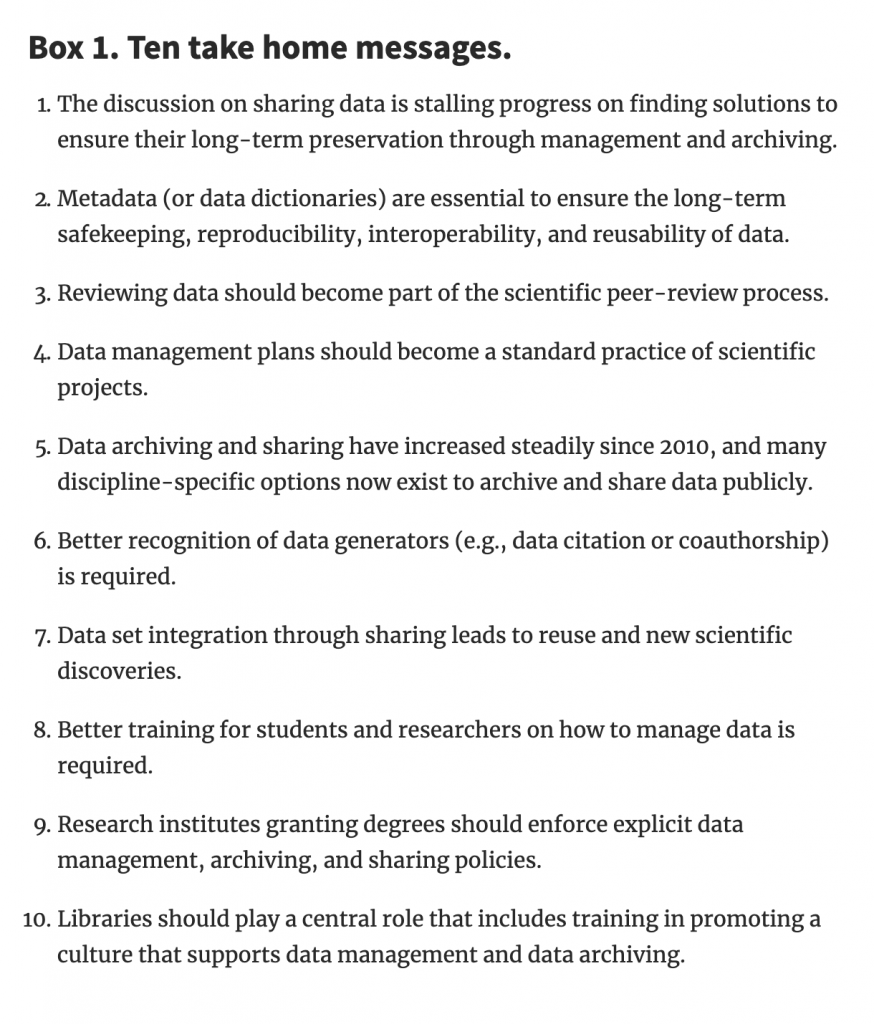
From Renaut et al. 2018. Management, Archiving, and Sharing for Biologists and the Role of Research Institutions in the Technology-Oriented Age. Bio Science 68 (6) 400–411.
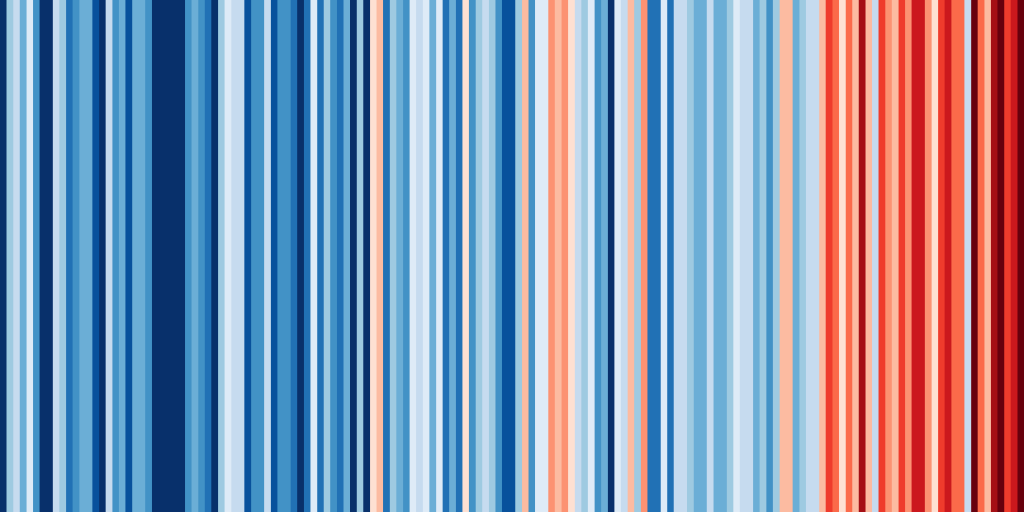
On this website, #showyourstripes you can create an image with the warming stripes of your country. Here are the stripes for Switzerland from 1864 – 2018.
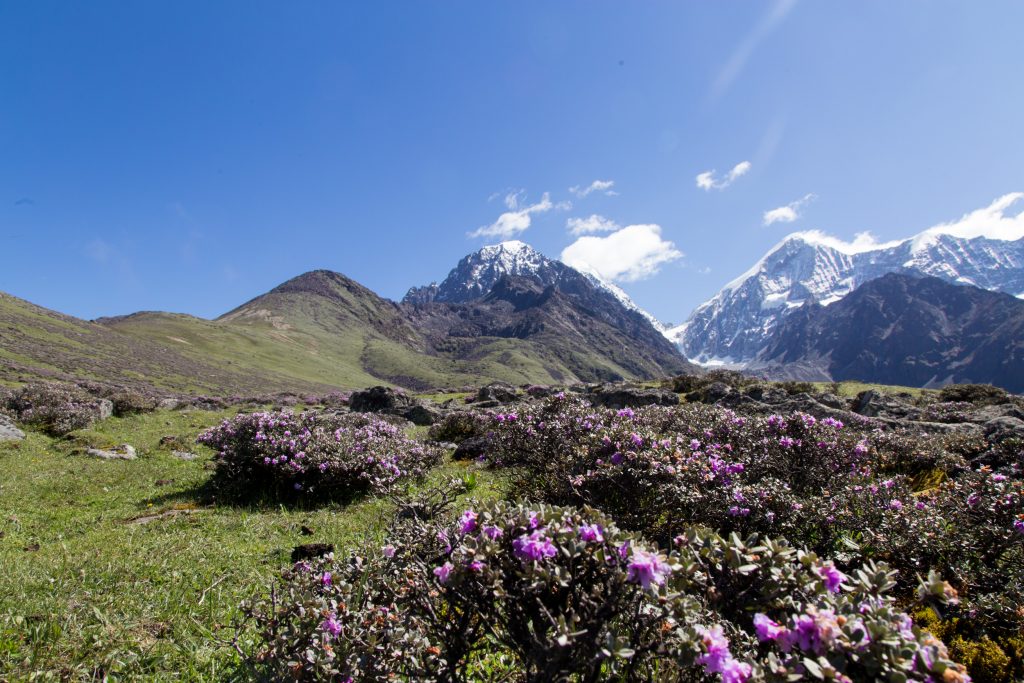
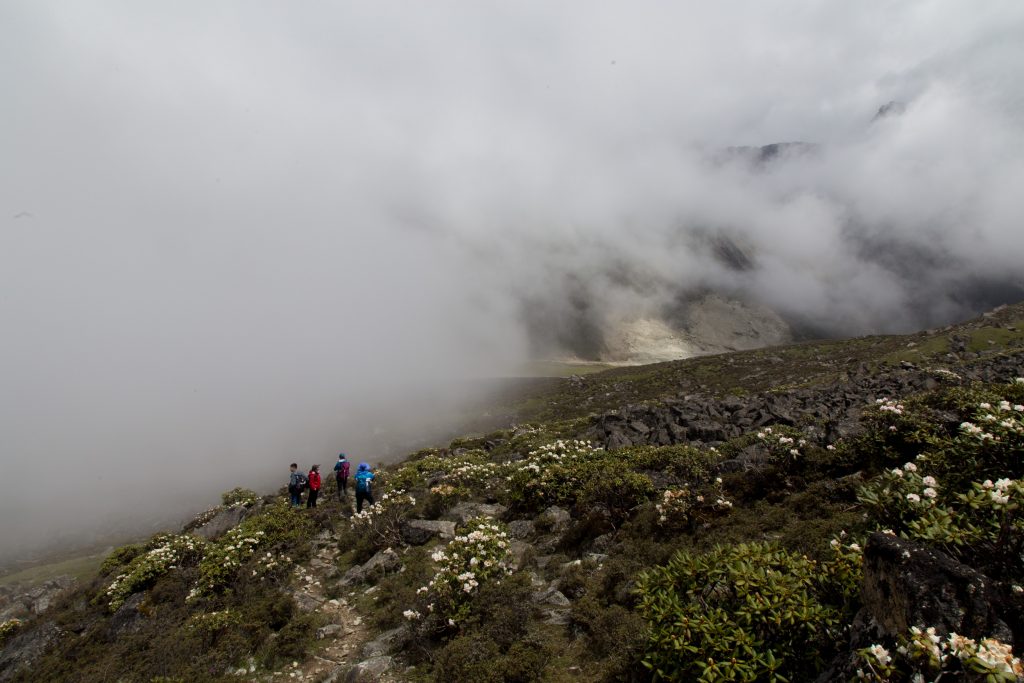
Last week I was in Mount Gongga setting up a new experiment. All the spring flowering was still in bloom. Here are just a few of them…
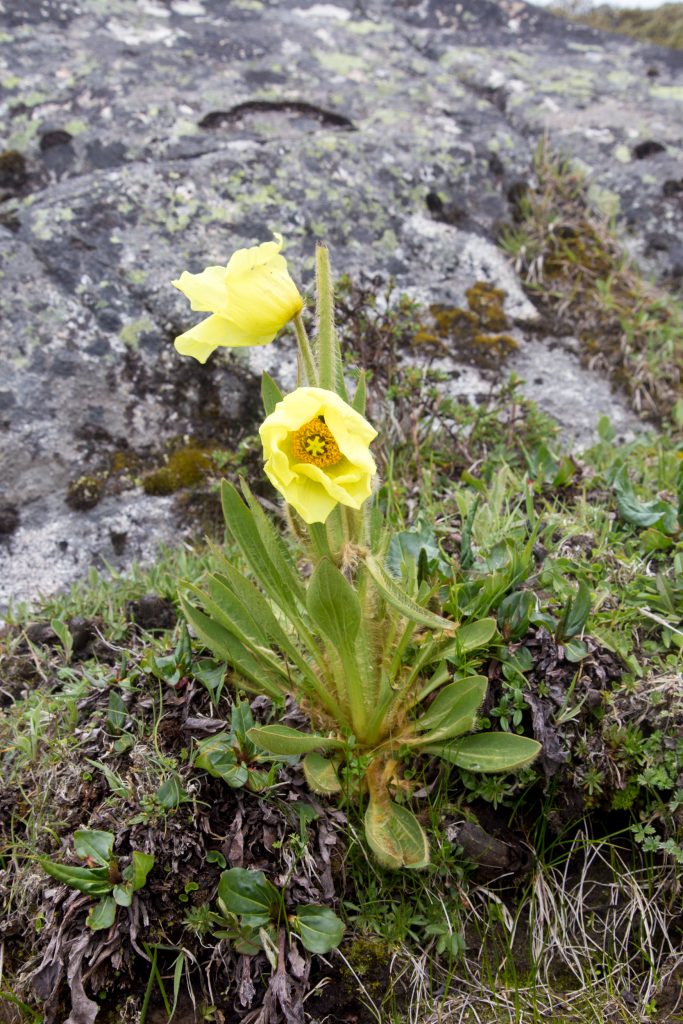
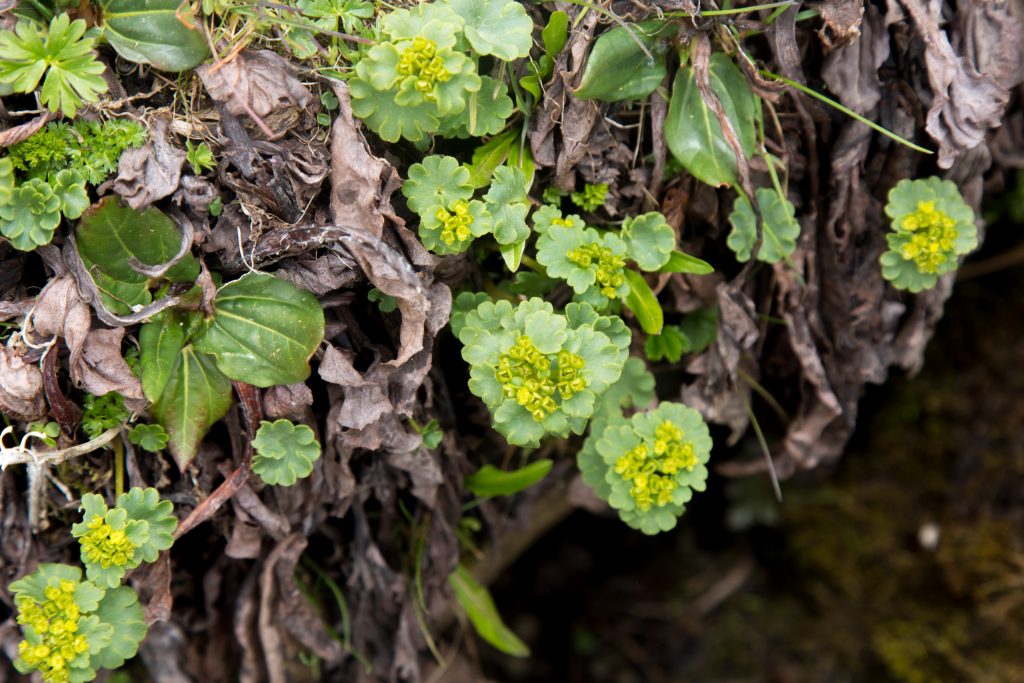
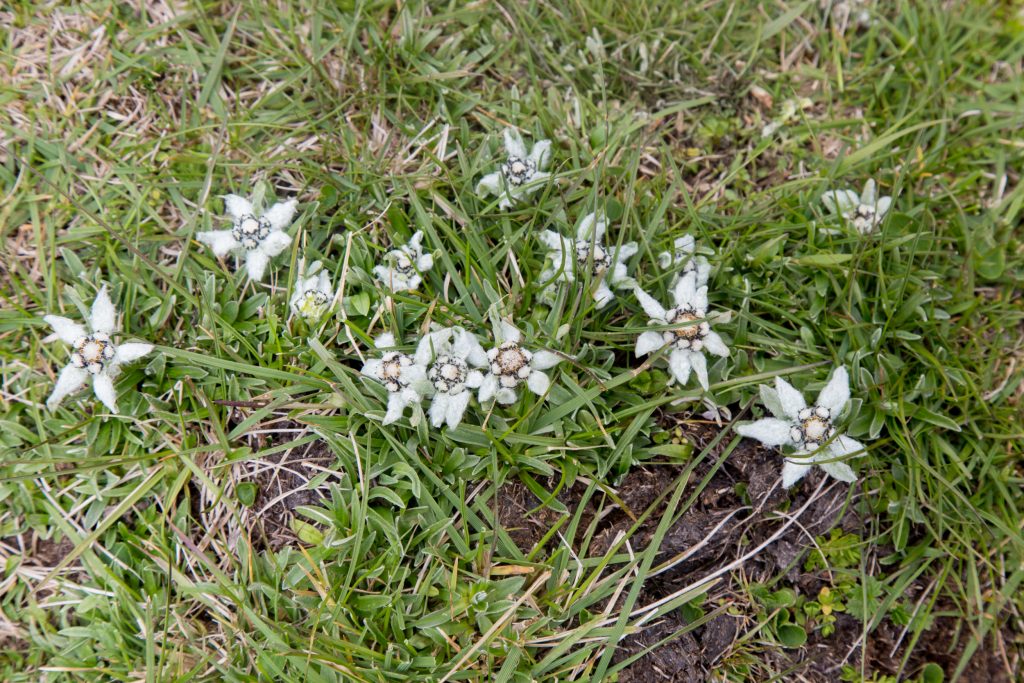
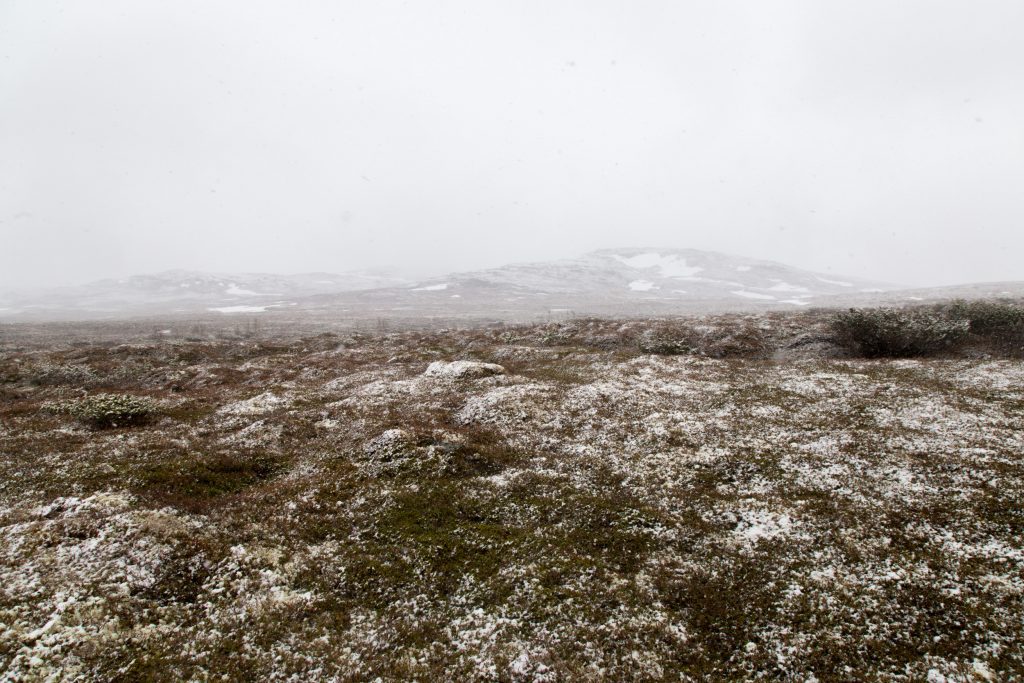
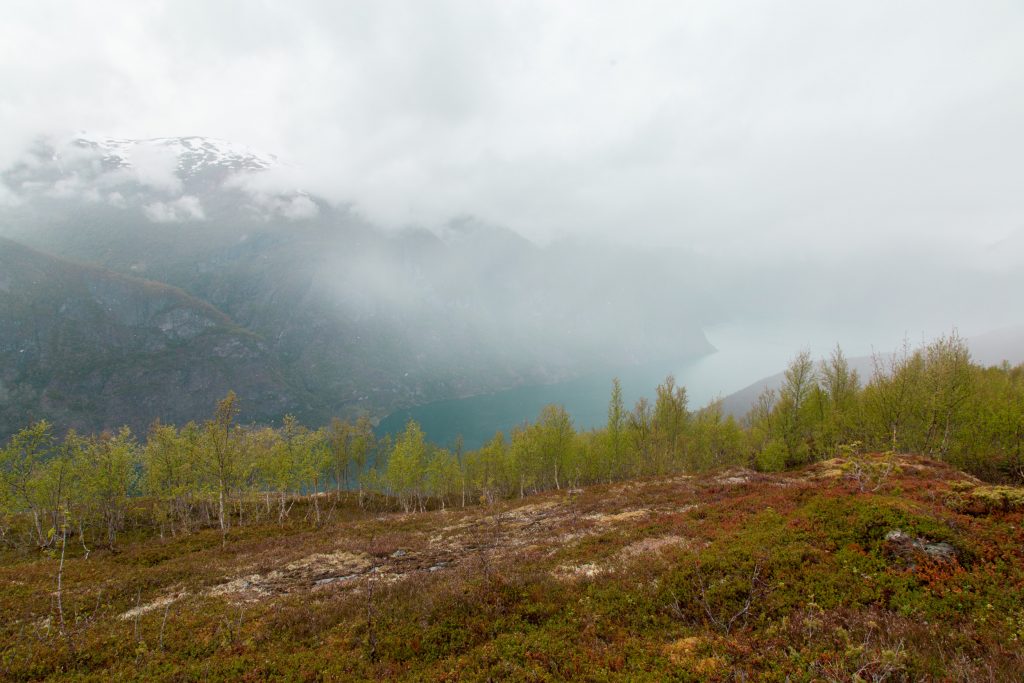
This week, I was in the field to train two students and find potential new field sites. The training was successfully done in decent weather, a mix of sun and clouds. But when we started to walk up the mountain, the snow came. It was snowing and hailing and raining, all in one.
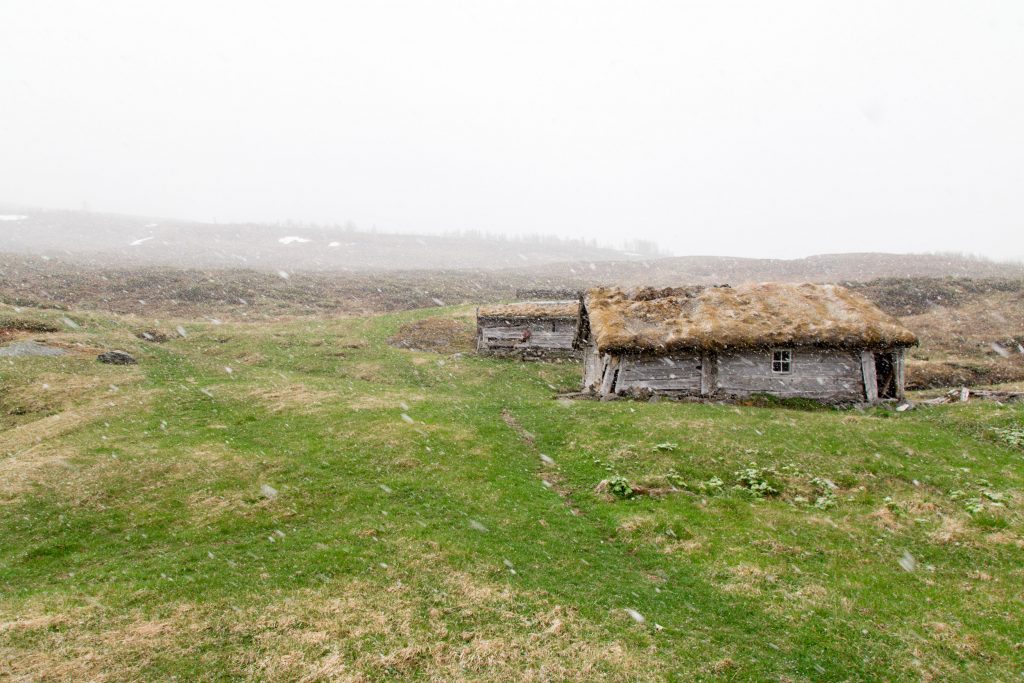
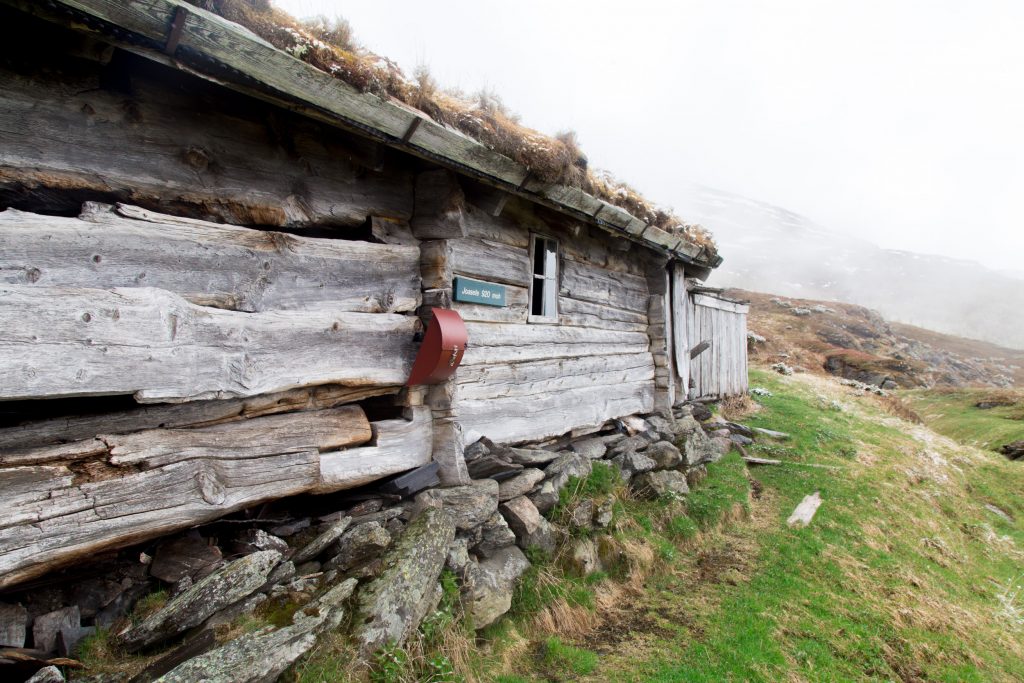
We found a beautiful summer farm, where I will have one of my field sites. It even has a letter box, where hikers can write their names when walking up the mountain.
I’ll have to come back to select the sites properly, set up plots. And then I will spend a lot of time staring at the plants. Looking forward to this!

Summerfield, R. J. 1999. Timing it right: the measurement and prediction of flowering. – Acta Agron. Hung. 47: 203–213.
Sack L, Cornwell WK, Santiago LS, Barbour MM, Choat B, Evans JR, Munns R, Nicotra A. 2010. A unique web resource for physiology, ecology and the environmental sciences: PrometheusWiki. Functional Plant Biology 387: 687-693.
IPBES (2019). Summary for policymakers of the global assessment report on biodiversity and ecosystem services of the Intergovernmental Science-Policy Platform on Biodiversity and Ecosystem Services.
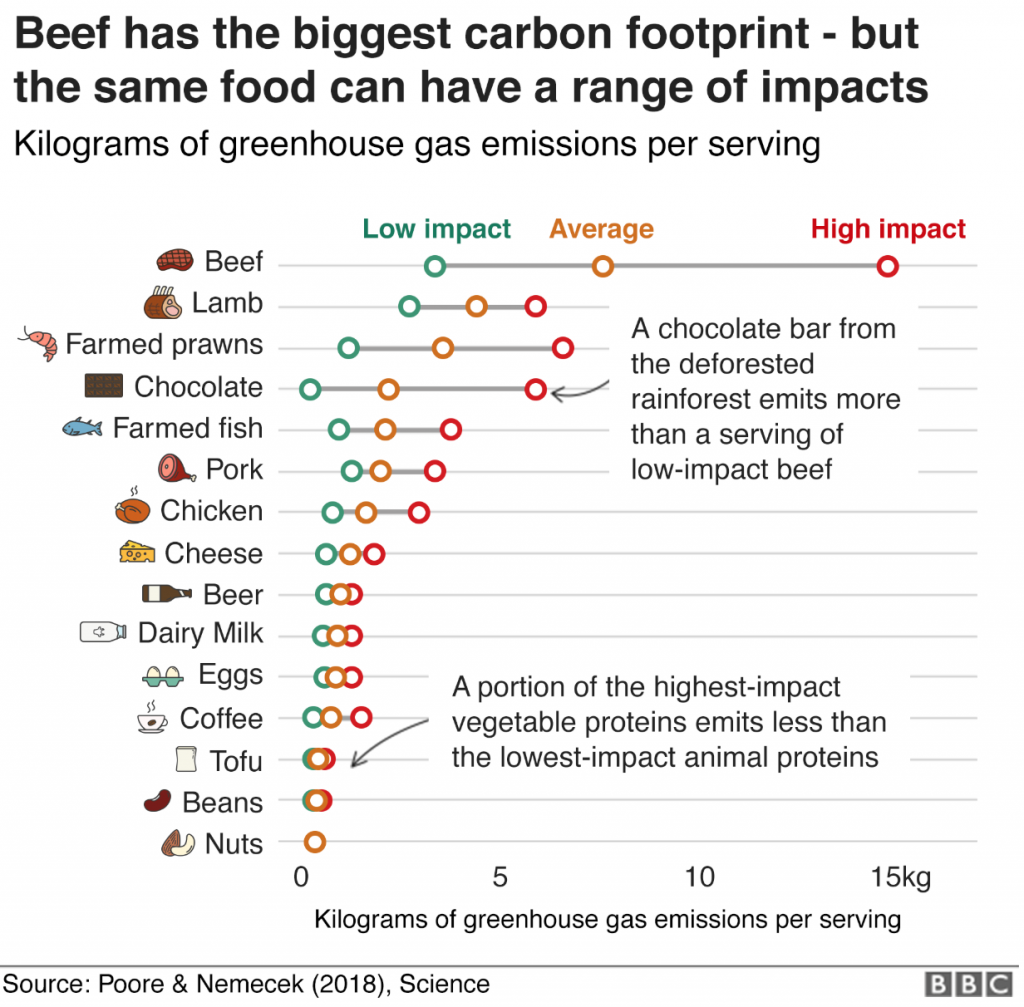
A new study from Poore & Nemecek shows the carbon footprint of our diet. BBC’s has made a tool, where you can check the carbon footprint calculator for what you eat. Not surprisingly, reducing meat and diary products reduces your environmental impact most (Poore & Nemecek, Science, 2018).
