Grazing and carbon storage in alpine ecosystems

Grazing has a long tradition in the alpine areas in Norway. In the last years grazing in alpine areas has gone down dramatically with consequences for the ecosystem. Grazing is an important factor in these areas and helps to shape the open grasslands we are use to.

In addition, grazing can be beneficial for the carbon storage in alpine soils. The important factor is the intensity of grazing, which should not be too high or too low. This is what the THREE-D project is investigating.

I have written a popular science article in the magazine Sau og Geit about these complex interactions and how grazing can be beneficial for nature. You can read the article here (in Norwegian).

How to measure plant species composition?

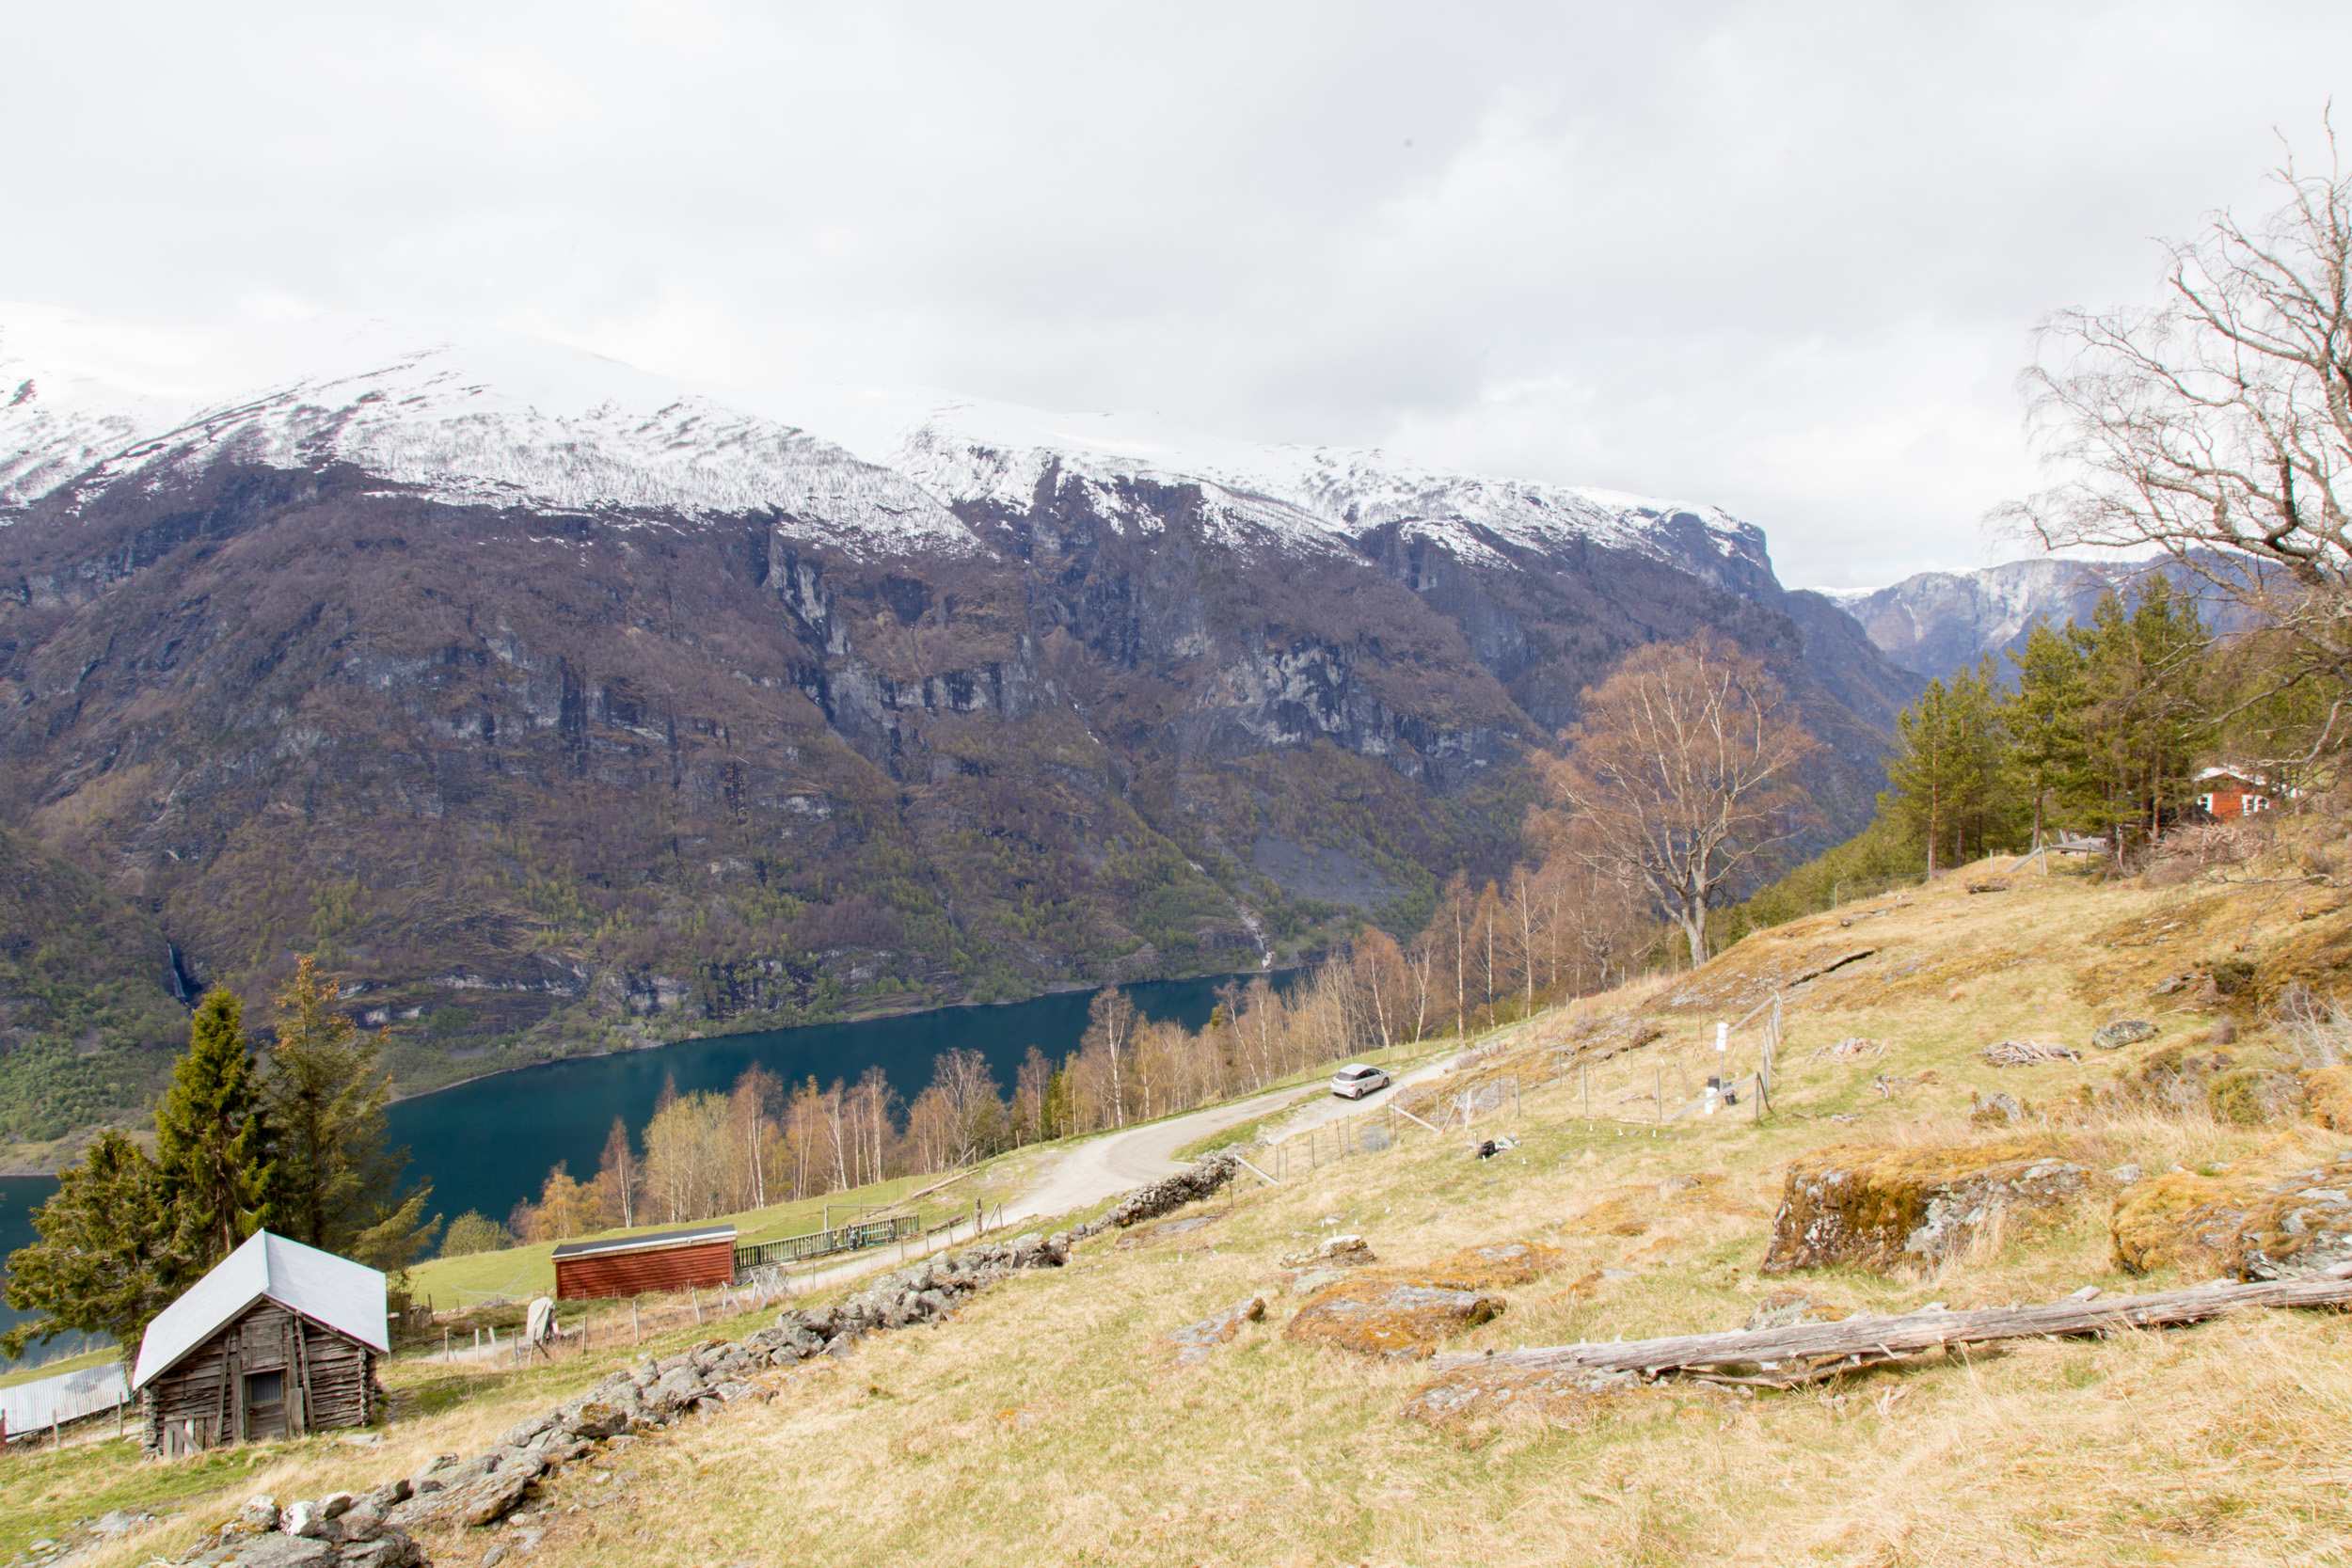
In the Three-D project we measure how plant species composition responds to global change. Plant species composition is a common response variable in community ecology. But how is it measured?

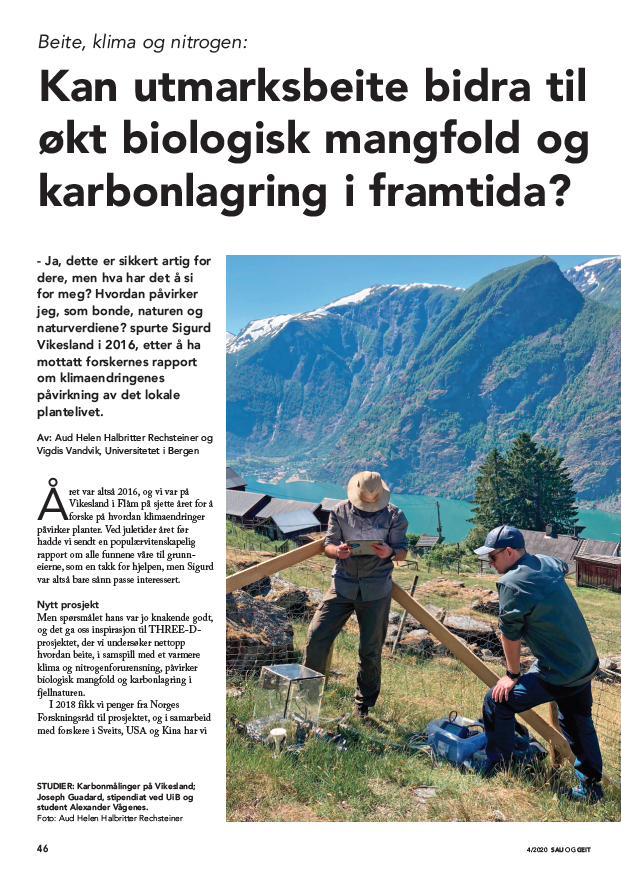
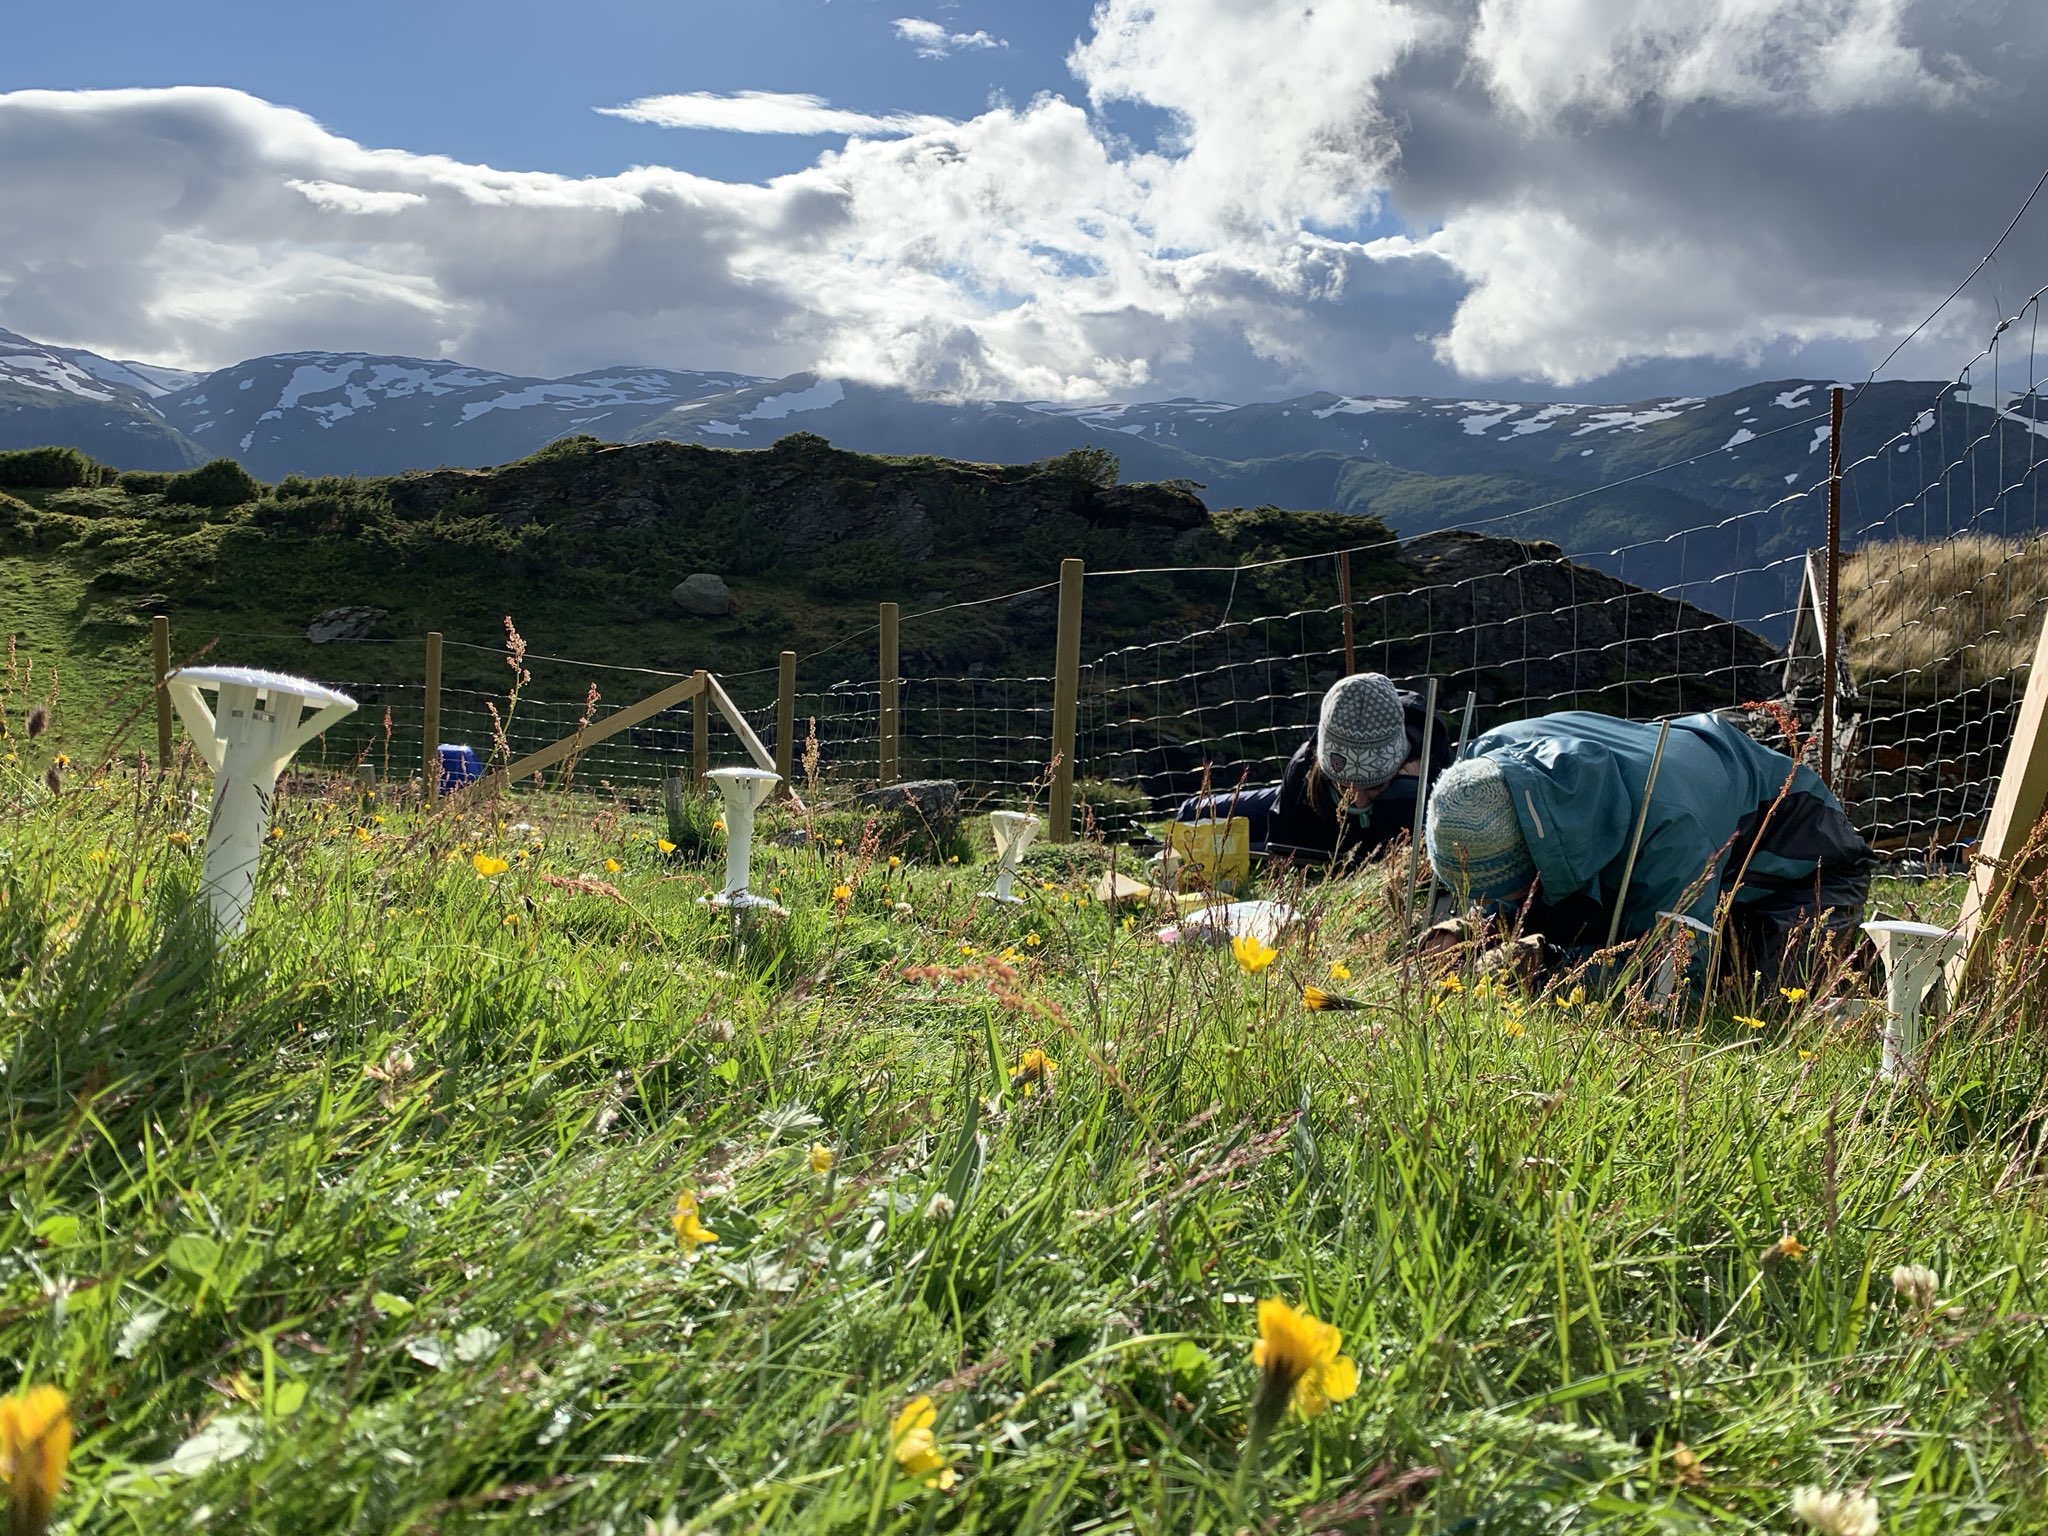
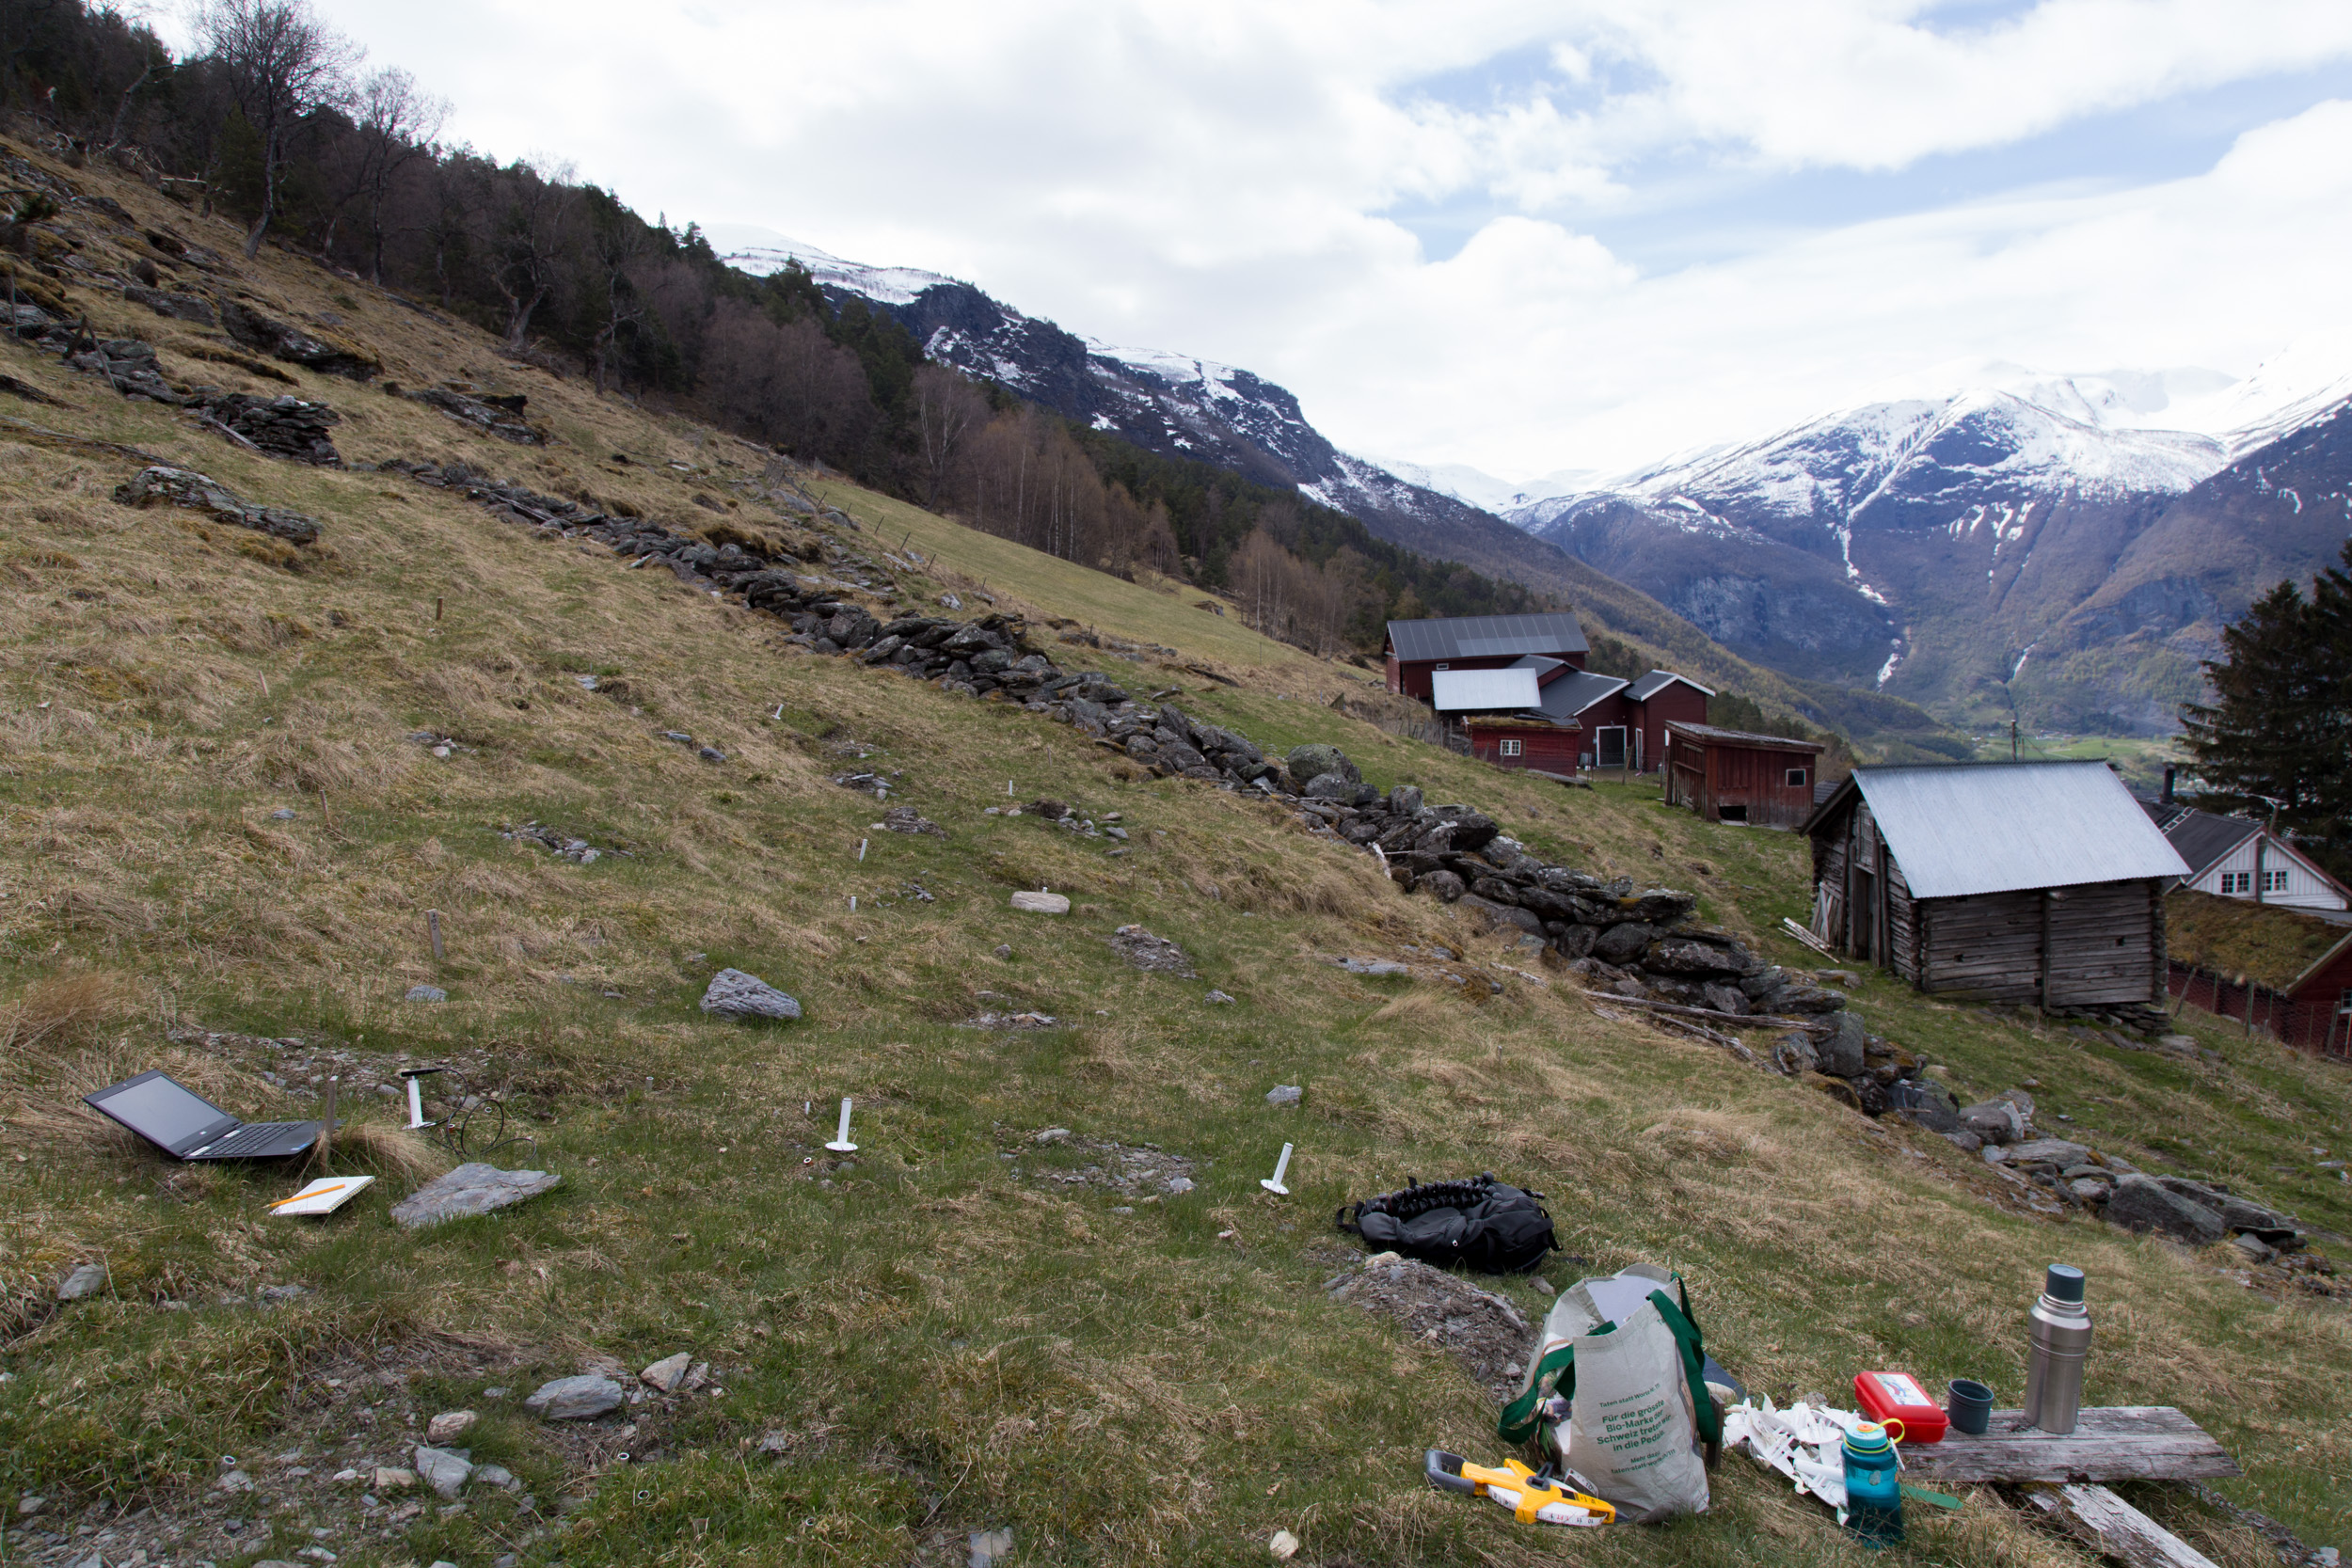
Recording species composition at Joasete, Norway. Photo: Vigdis Vandvik.

Basically, we lie on the grass the whole summer and stare at the vegetation. My husband once said when asked what I am doing „She pets the plants“. That’s pretty much what it looks like, but there is a bit more to it.

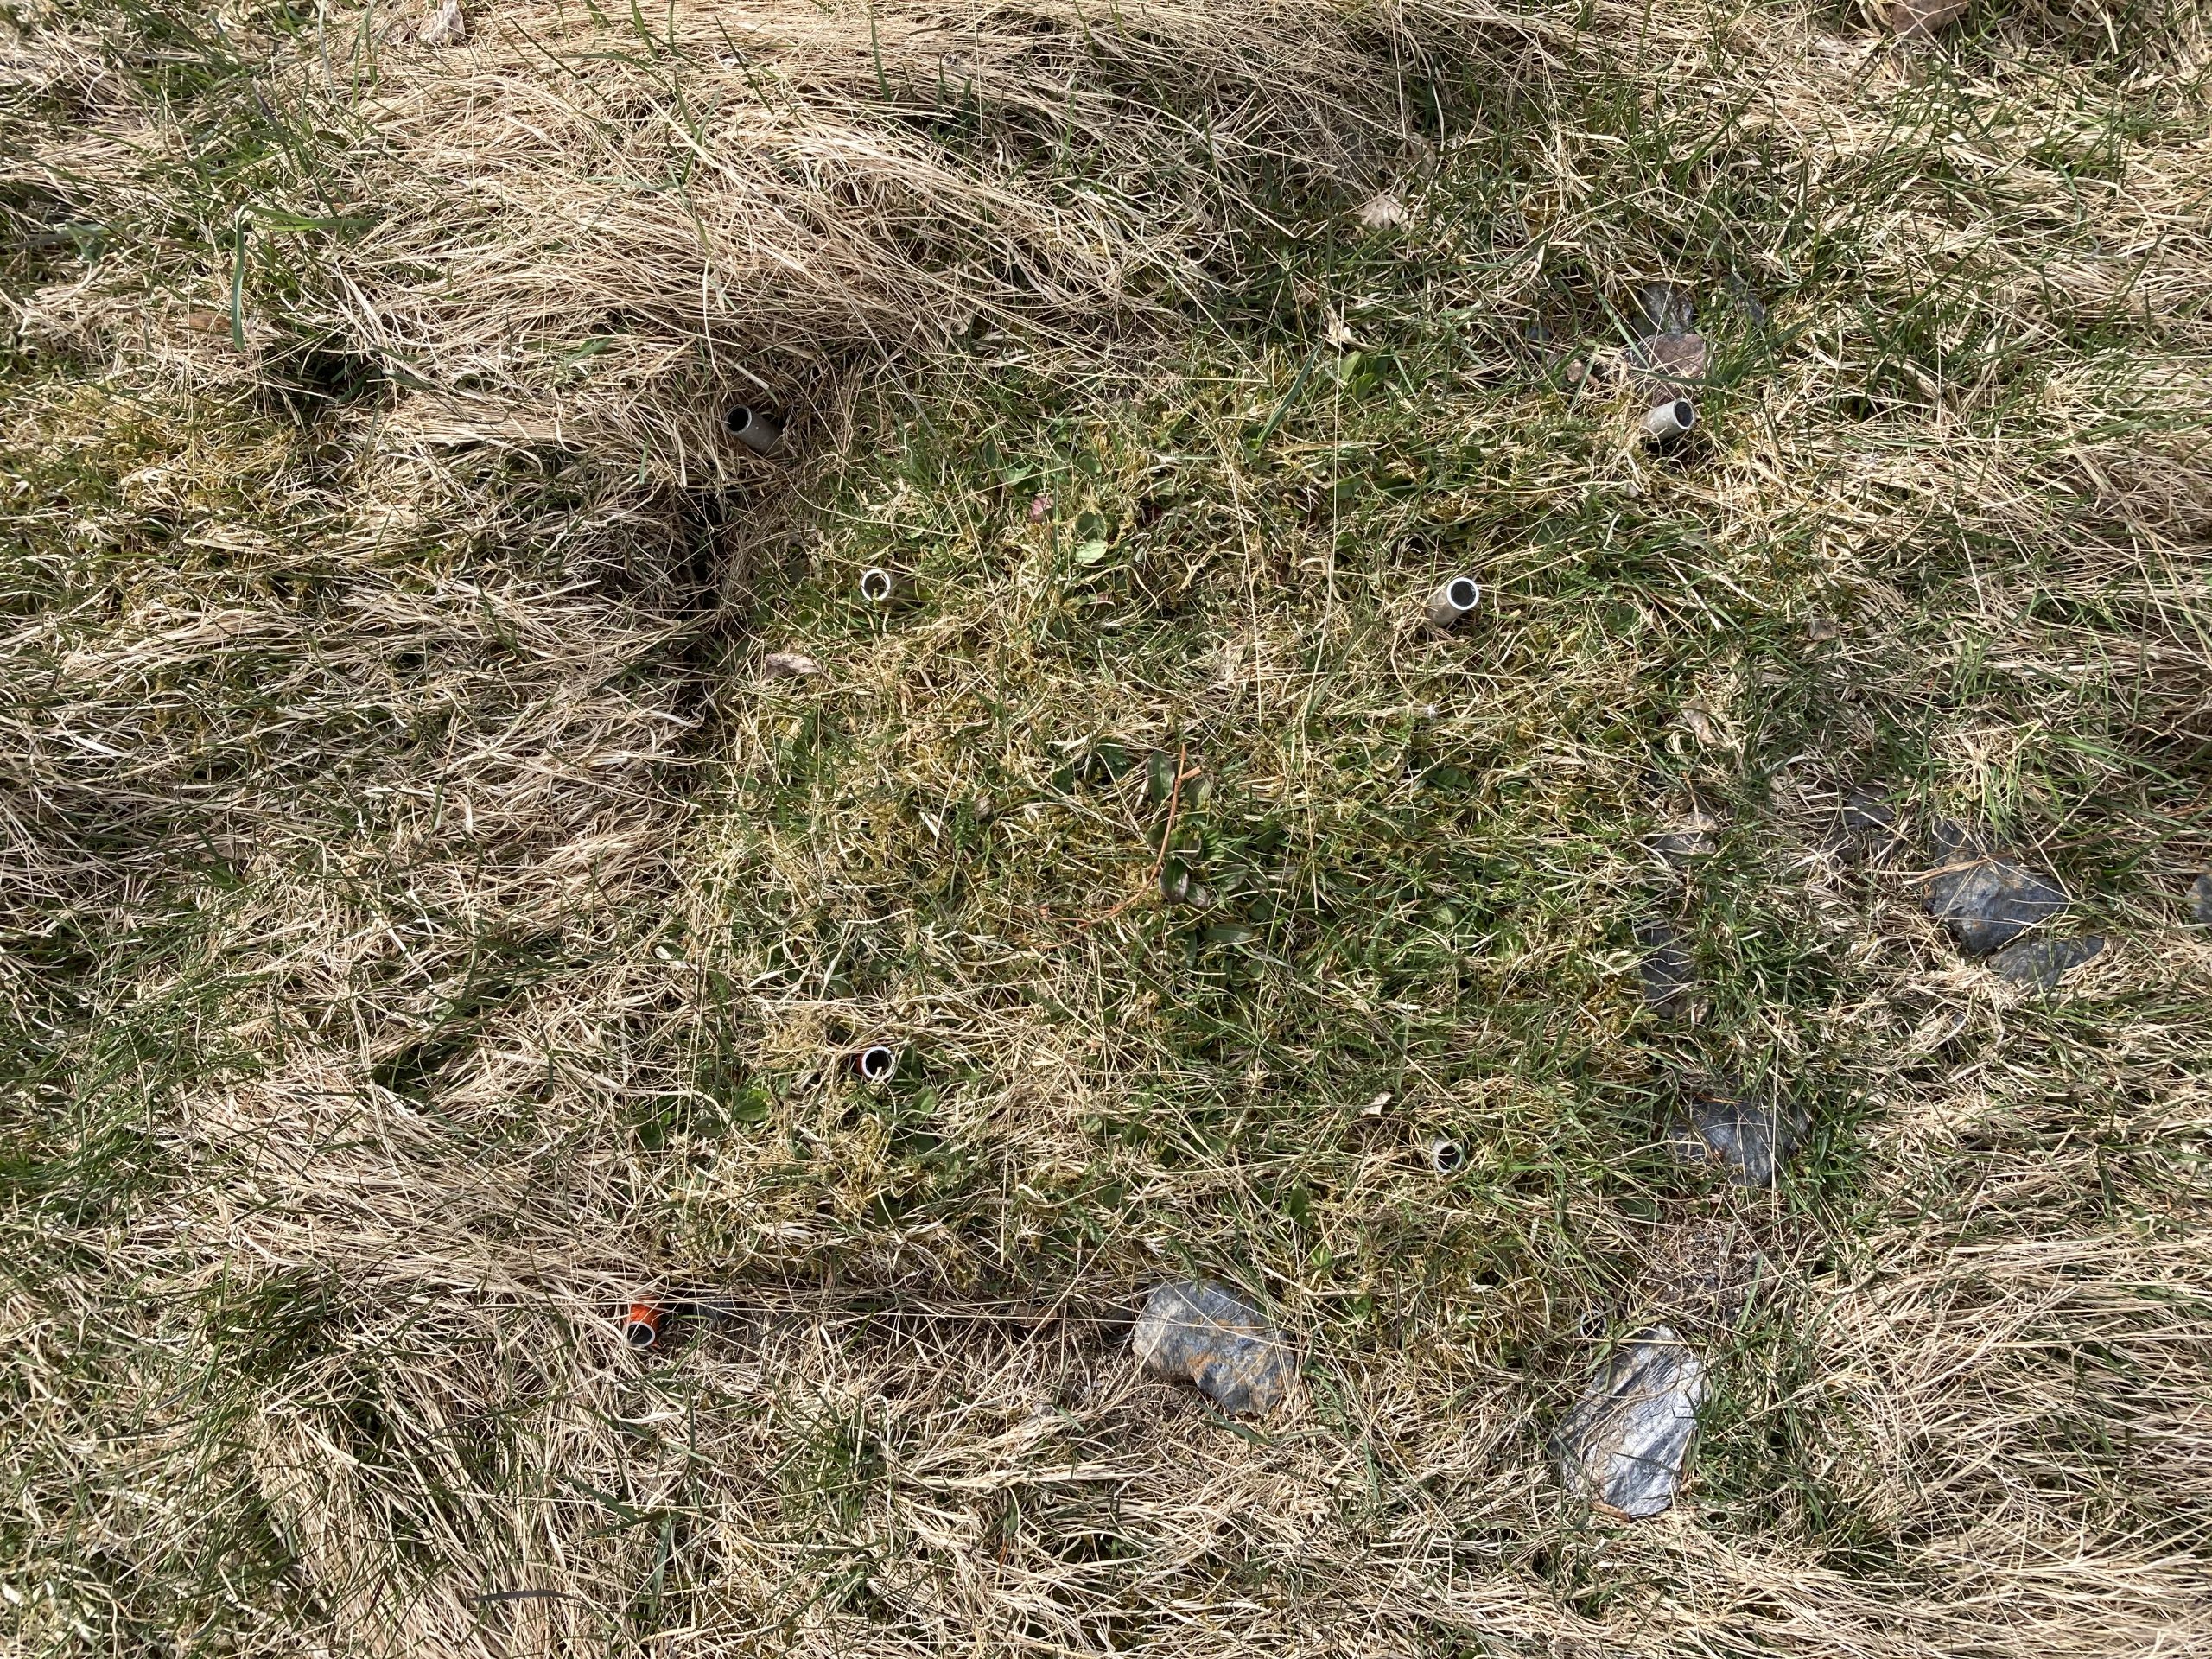
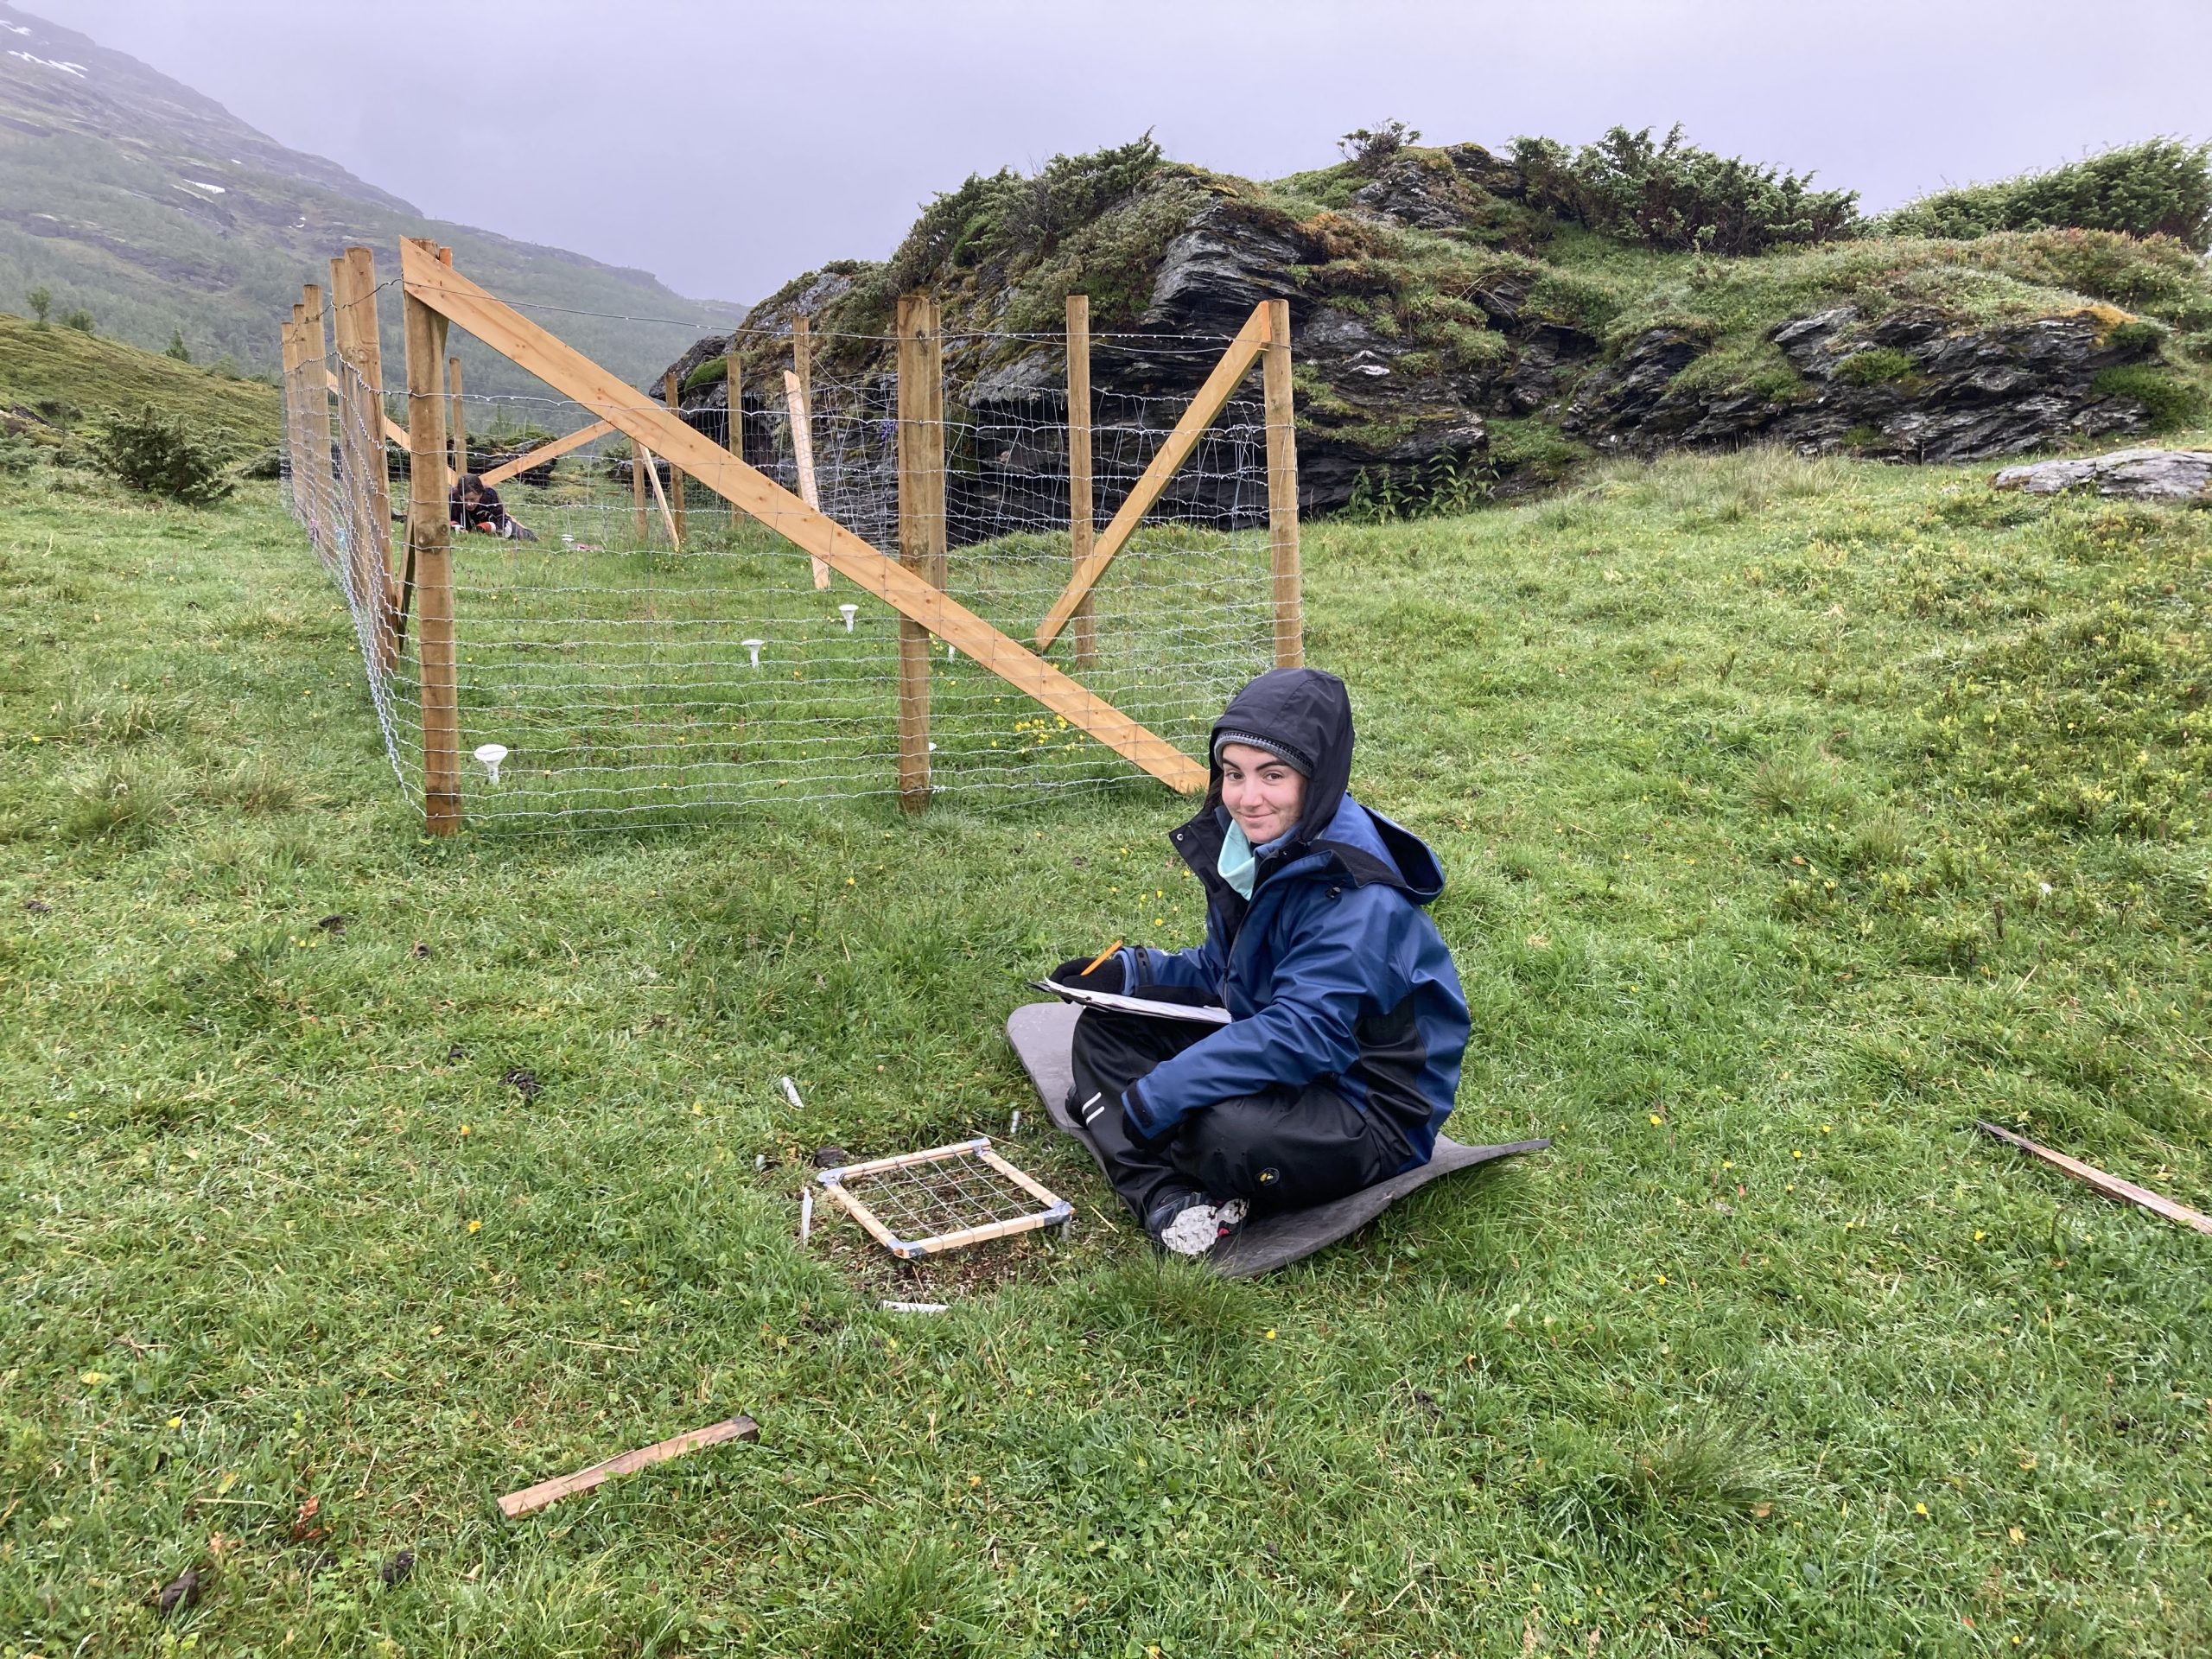
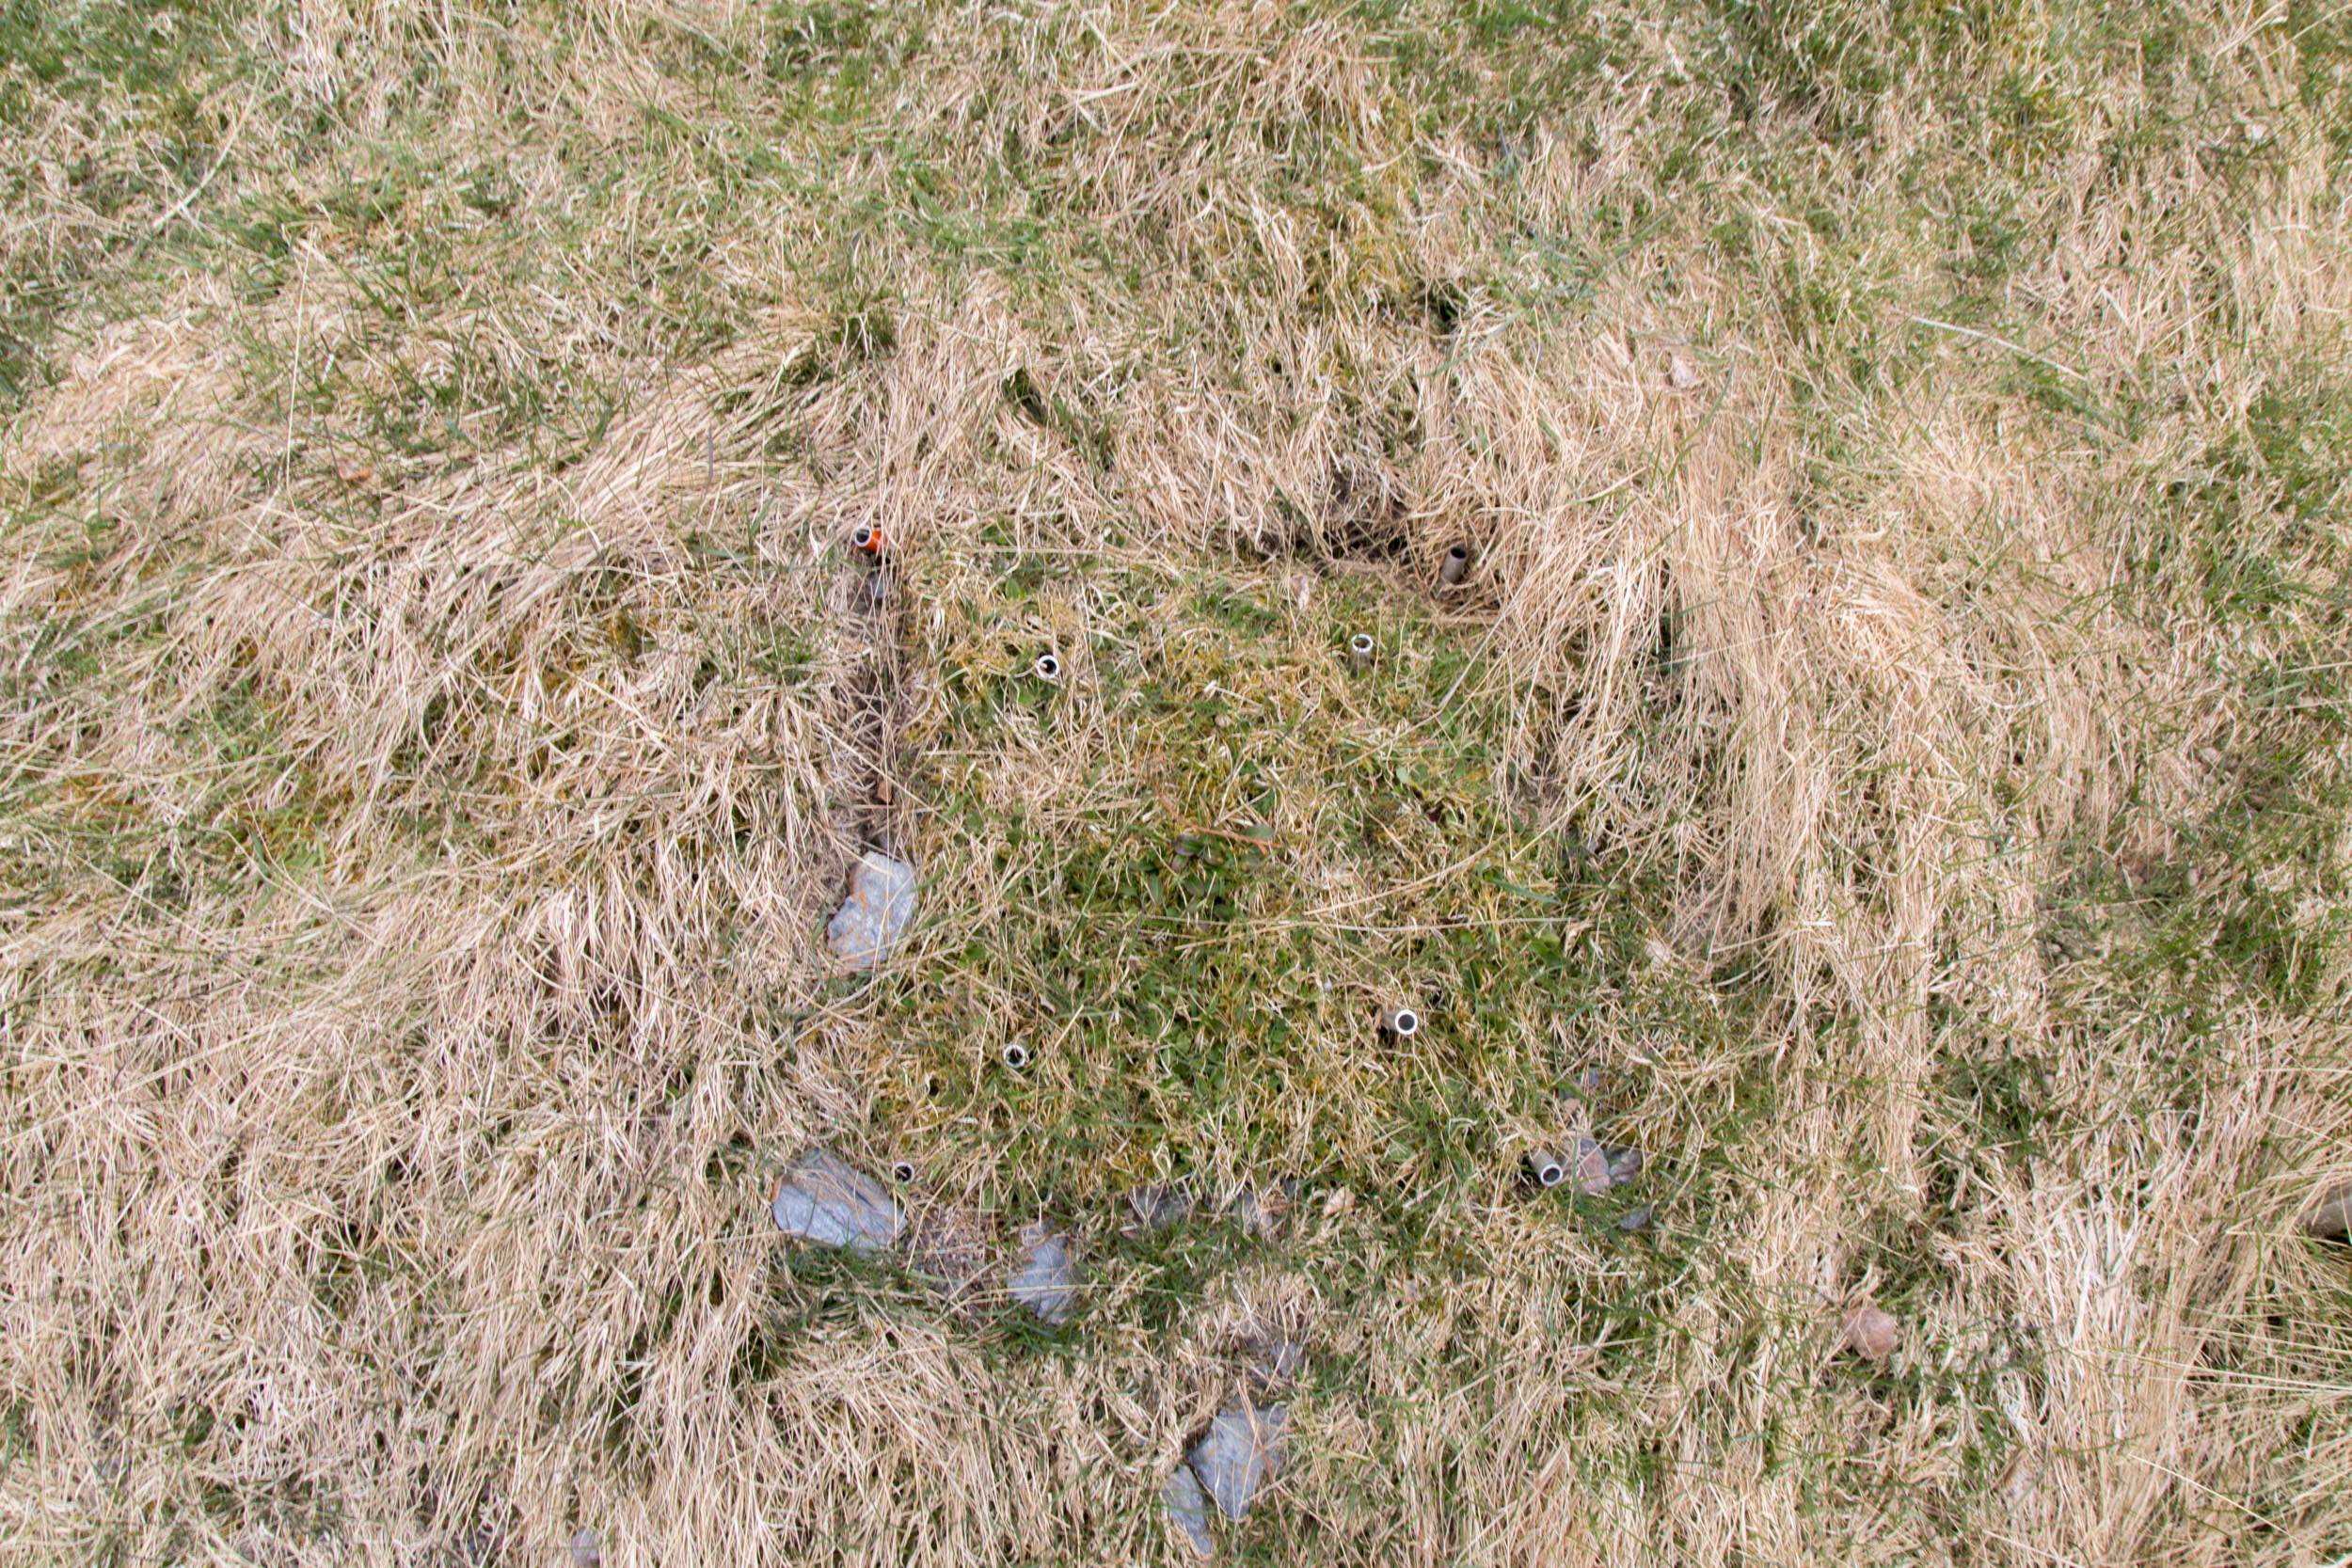
We are using the visual cover estimate method. Our plots are 25 x 25 cm large, and marked permanently with metal tubes in each corner to relocate the plots each year. For the measurements, we use a metal frame, the same size as the plots with a grid of 25 subplots. In every subplot, we record the presence of all graminoid and forb species. In addition, we also record if a plant is fertile (if it has buds, flowers, seeds), is a seedling, juvenile or dominant (covers > 50% of the subplot). Once all the species are recorded in each subplot , we visually estimate the cover of each species on the whole plot. This might seem like an inaccurate method. Yes, it needs some practice to estimate the cover and some species are more difficult than others. If several people record the data, they need to standardize their estimates at the start. We usually estimate the cover for a couple of plot together in the beginning to calibrate.

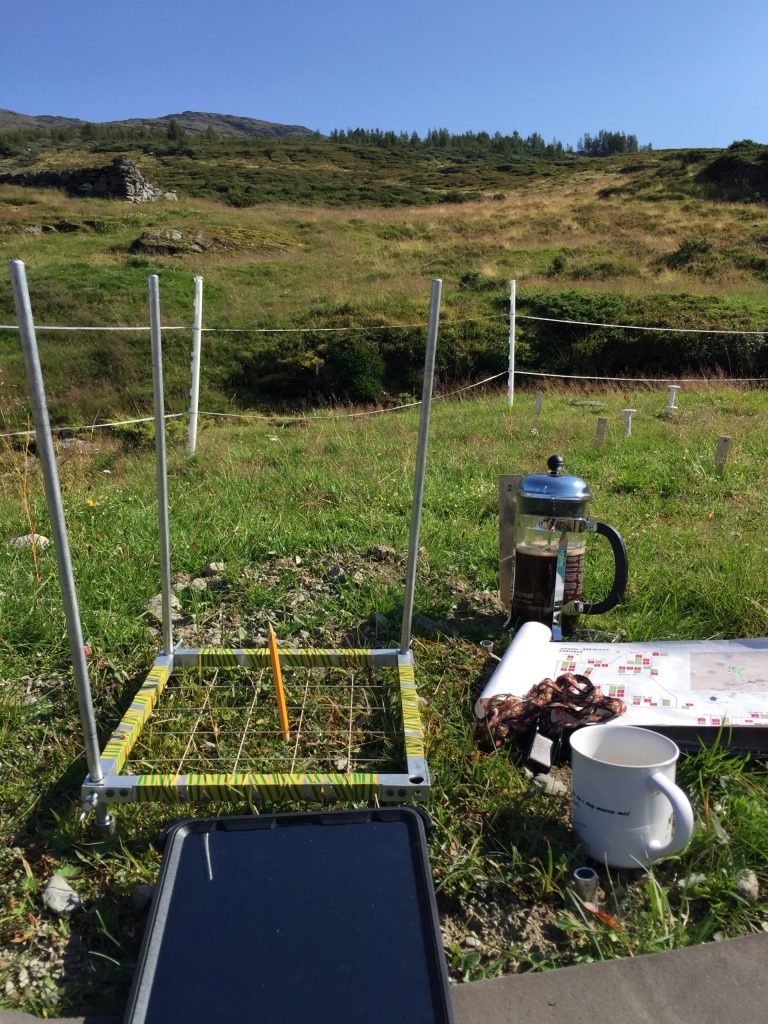
Using a metal frame with 25 subplots to estimate plant cover.

How do we deal with unknown species? That’s a good question. There are always a couple of plants that cannot be identified. It can be because they are seedlings, juvenile, funny shaped, sterile, grazed or damaged. For the seedlings, which are not always easy to identify we have a column where we count the number of seedlings in each subplot. If the plants are not fully grown and difficult to identify, we note down juvenile to indicate the identity is not 100% certain. Usually, the following year, the species is fully grown and we know what it is.

Sterile or damaged graminoids are often a problem. For example, to identify Carex species it is important to have the flowers, seeds and leaf tips. But the species do not flower every year and sometimes get chewed on. When we have species that cannot be identified, we give them descriptive names, like „Dark green thin m-shaped Carex“, „Beautiful Agrostis“, „Carex norvegica cf“. And we add a description of the species. Sometimes in the next plot you come across the same species with a flower and can identify it. Other times you have to wait until the next season to solve the riddle. The important thing is to describe the plants suficiently and make sure to divide the unknown plants into different species. They can always be merged later if they turn out to be the same species. It is impossible to divide them into different species later.

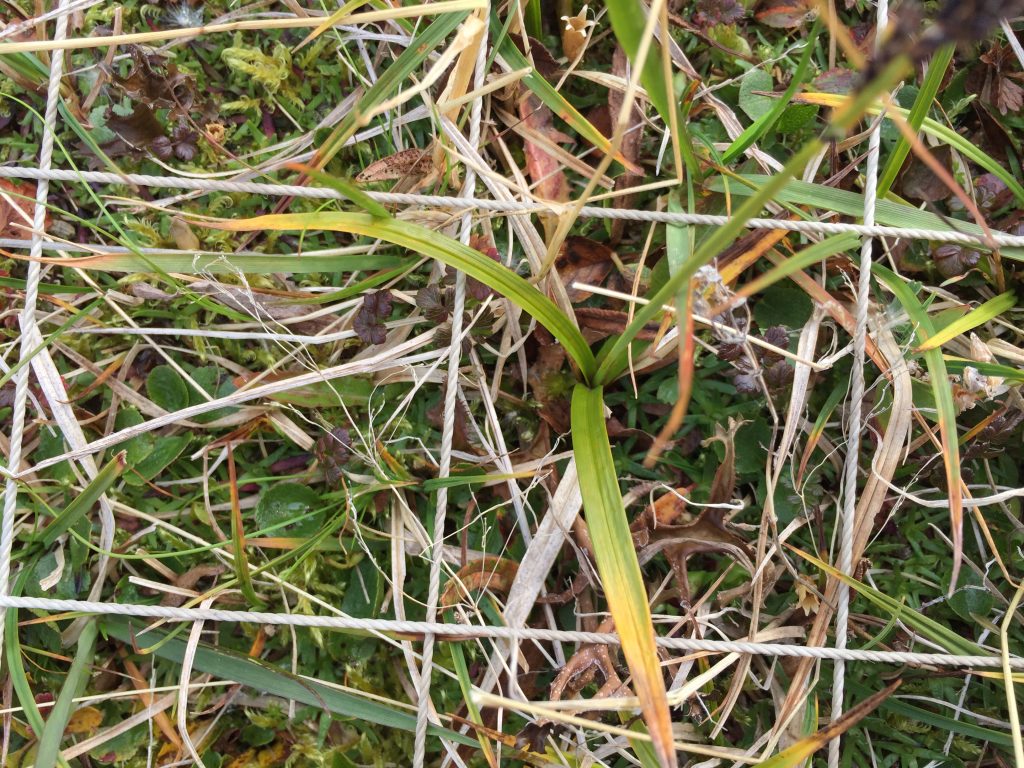
A sterile Carex species.

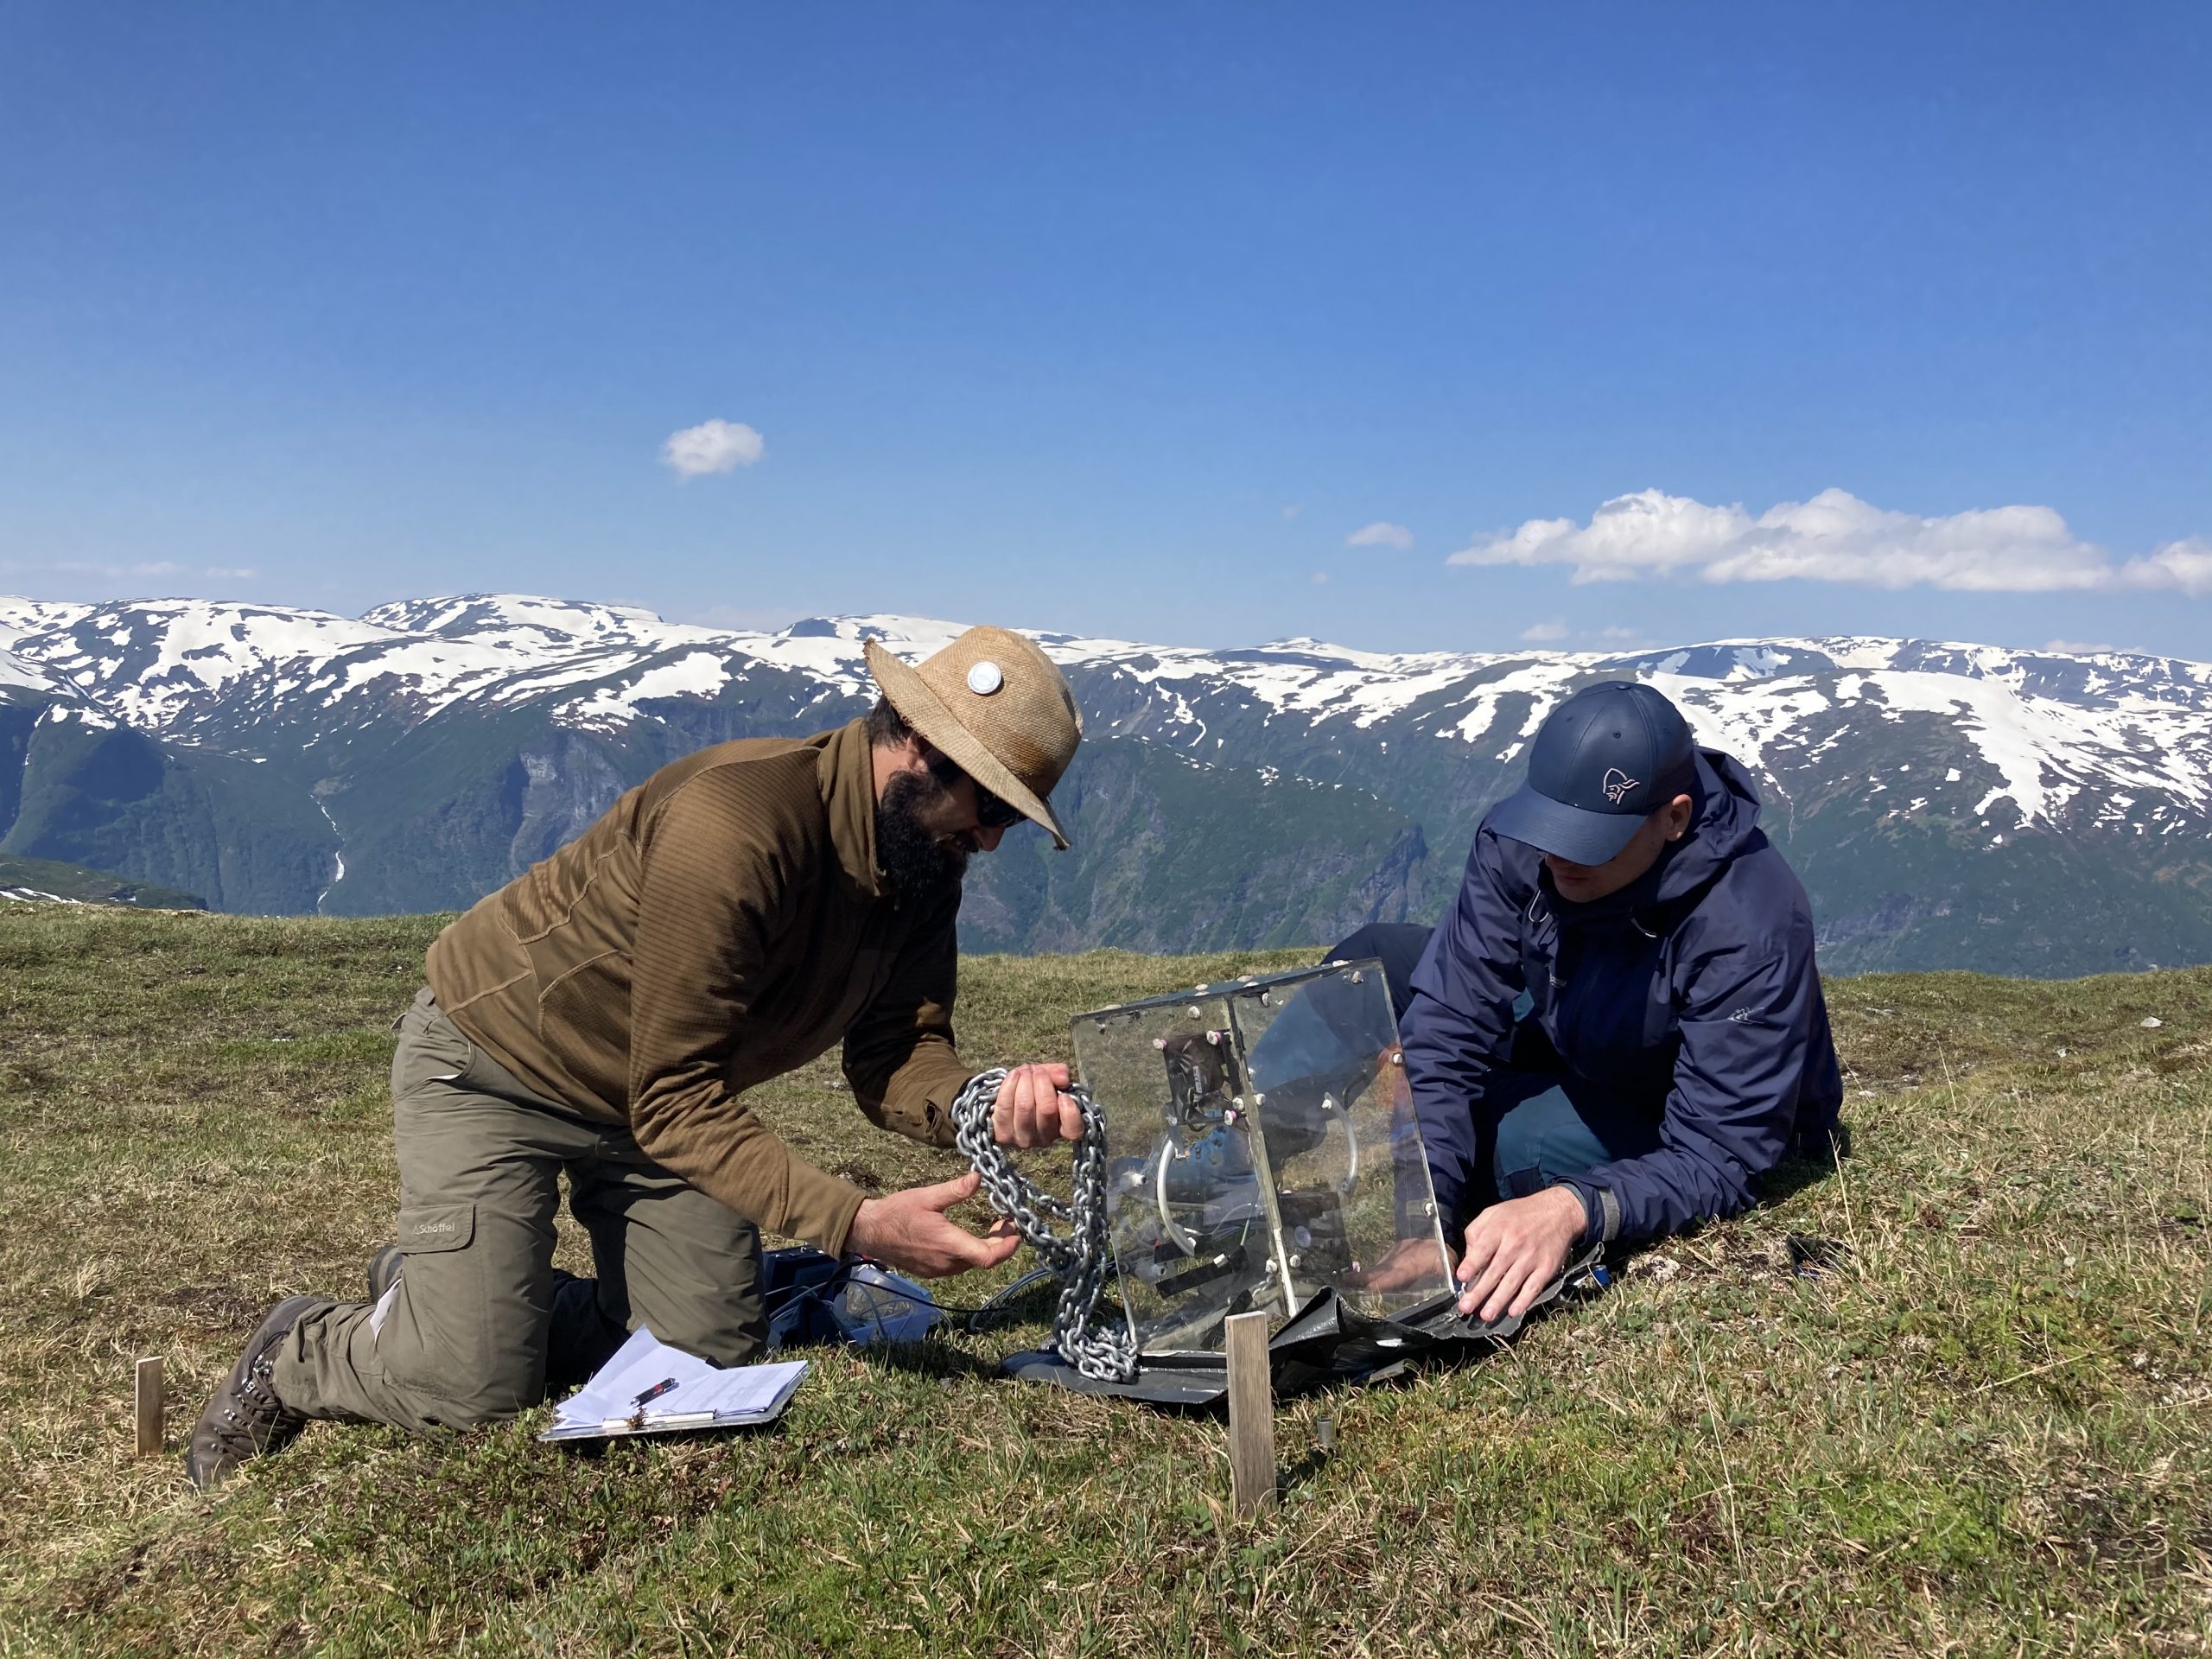
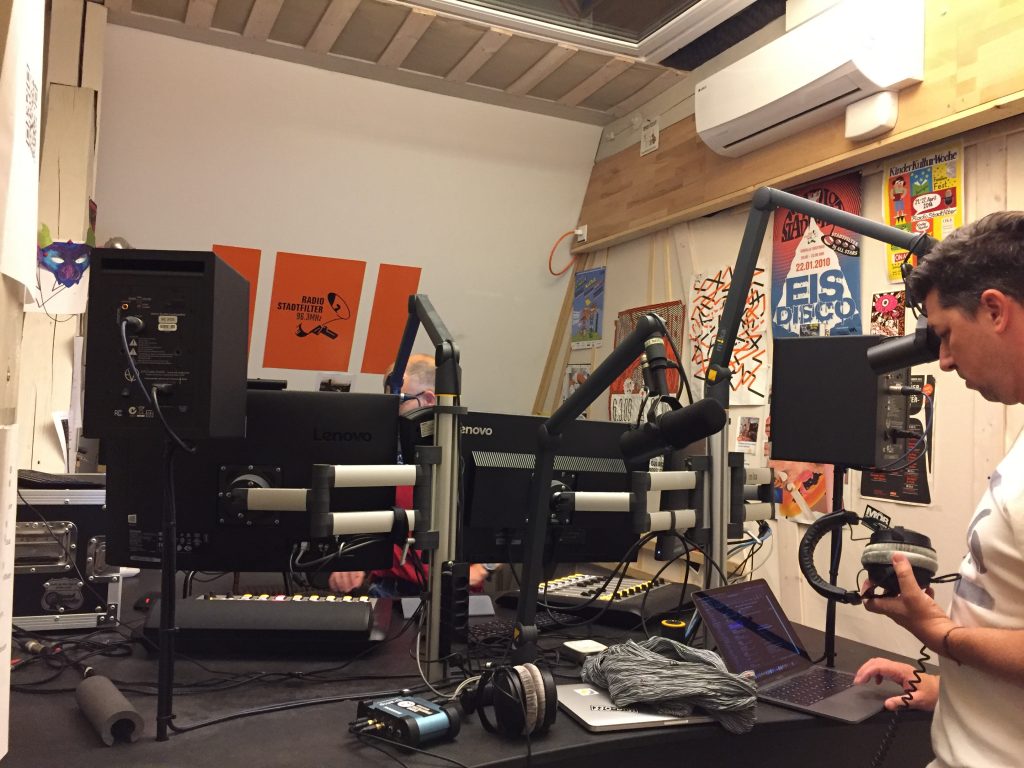
What can be done to ensure quality control? There are several things that can be done. If several people do the recording, some of the plots should be done twice by two different people to compare the results. This is time consuming, but very useful. I always take a picture of each plot. This can help me when I am processing and cleaning the data to solve issues with the data. Recording species cover is time consuming and it is important to take the time it needs in the field to find and identify all the species. I have started to use a tablet to record the data in the field. And the data sheet is a little bit intelligent and can tell me if I am missing some data or if numbers are completely wrong. This is a great help to avoid mistakes that happen very often when recording data on paper.

For more details, see the ClimEx handbook of standardized measurements, protocol 4.8 Plant Community composition.

Three-D field work in the Corona time

Field work is always the busy season for plant ecologists. We maintain the experiments, collect new data, deal with unexpected situations and issues, and try to cramp in as much work as possible into a few weeks. Due to the Corona situation this year, the field season was uncertain for a long time and it was unclear if we could do the work at all. Slowly, we made plans for what was essential and things that could be dropped.

Three-D field sites are located in the beautiful fjord landscape, with large gradients from sea level to the alpine.

For the Three-D project the most important thing was to keep the experiment running. This meant, building fences around the plots that were established last year and to apply the treatments. The treatments in this project are warmer climate by transplants (so nothing to do there), nitrogen addition and clipping (simulate grazing). The first problem was to order a slow release nitrogen fertilizer. I contacted some colleagues from Nutnet (Nutrient Network) and they kindly helped me out with advice. I finally managed to order 600kg of fertilizer. The last treatment is a clipping treatment, where we simulate different levels of grazing. For this, we are clipping and removing the vegetation in the plots 2-4 times during the growing season.

A transplanted plot at the beginning of the field season.

We clip the vegetation with scissors and sort them into different functional groups.

For the measurements, we are interested in change in plant community and ecosystem function in response to warming, nitrogen and grazing. For this, we record presence/absence and cover of all vascular plants and carbon fluxes. We decided to reduce these measurements to a minimum, only on the controlled and warmed plots.

Joseph and Alex measuring carbon fluxes using a Licor and a plexiglas chamber.

Leire, our IAESTE intern from Spain, recording functional group cover.

So far the field work has been going well and the experiment looks good. The plants are responding to the treatments and we have collected all the data we wanted. We are also taking other measures to keep the people save. We follow strict hygiene rules, work in small groups, and try not to mix the people. We are very grateful that nobody has gotten sick yet.

Sheep grazing at Joasete.

First field day

Yesterday, was the first day in the field after winter break. It was good to get out of the city, drive trough the country side and spend a couple hours outside and far away from my home office.

I stopped at Flåm and it was strange to see the place so empty. Usually this place is swamped with people and cruise ships at this time of the year. Sadly, Flåm and Aurland are the places with the highest unemployment rate in the country. Hopefully, things are getting back to normal soon.

It is very cold at the moment and summer is far away. There is a lot of snow in the mountains that still has to melt. Who know when the field season in the mountains will start.

The turfs I transplanted last summer look happy. The Tomst loggers that measure the microclimate do not. They have all lost their „hats“ (protection from direct sunlight). Probably the snow, but maybe also deer that found something to play with.

The next step will be to get a fence around the plots, to protect them from the goats.

Virtual conference

I was supposed to go to a conference next week; the EGU in Vienna. But I am not going to the conference now, as almost no travelling, meetings and going to work is happening at the moment. The conference is still happening, but everything is going to be online.
I made a poster to present the ClimEx Handbook and hope for fruitful discussions during our sessions. Come and visit our session:

BG2.23 Whole system approaches in addressing processes and long-term changes in terrestrial and aquatic ecosystems

Windy

Windy is a great resource providing global weather forecast. And beautiful maps on wind, precipitation, temperature, clouds, waves and much more.

Dragons in Nature

Nature has some great articles about dragons, that I came across lately. They are old, and probably well known. But I wanted to list them here anyway.

The first one by Hamilton, May and Waters is a warning that with climate change, the conditions for dragon breeding are rapidly reaching ideal conditions. And they are warning that the „Third Stir“ might take place soon.

The second article I came across is on the ecology of dragons by May. It is about the ecology and origin of dragons and why they might have gone extinct.


References

Hamilton, A., May, R. & Waters, E. Here be dragons. Nature 520, 42–43 (2015) doi:10.1038/520042a.

May, R. M. (1976). The ecology of dragons. Nature264(5581), 16.