Archiv der Kategorie: Allgemein

New article from our lab in GCE on population dynamics in grasslands

From facilitation to competition: temperature-driven shift in dominant plant interactions affects population dynamics in semi-natural grasslands

Siri L. Olsen, Joachim P. Töpper, Olav Skarpaas, Vigdis Vandvik and Kari Klanderud

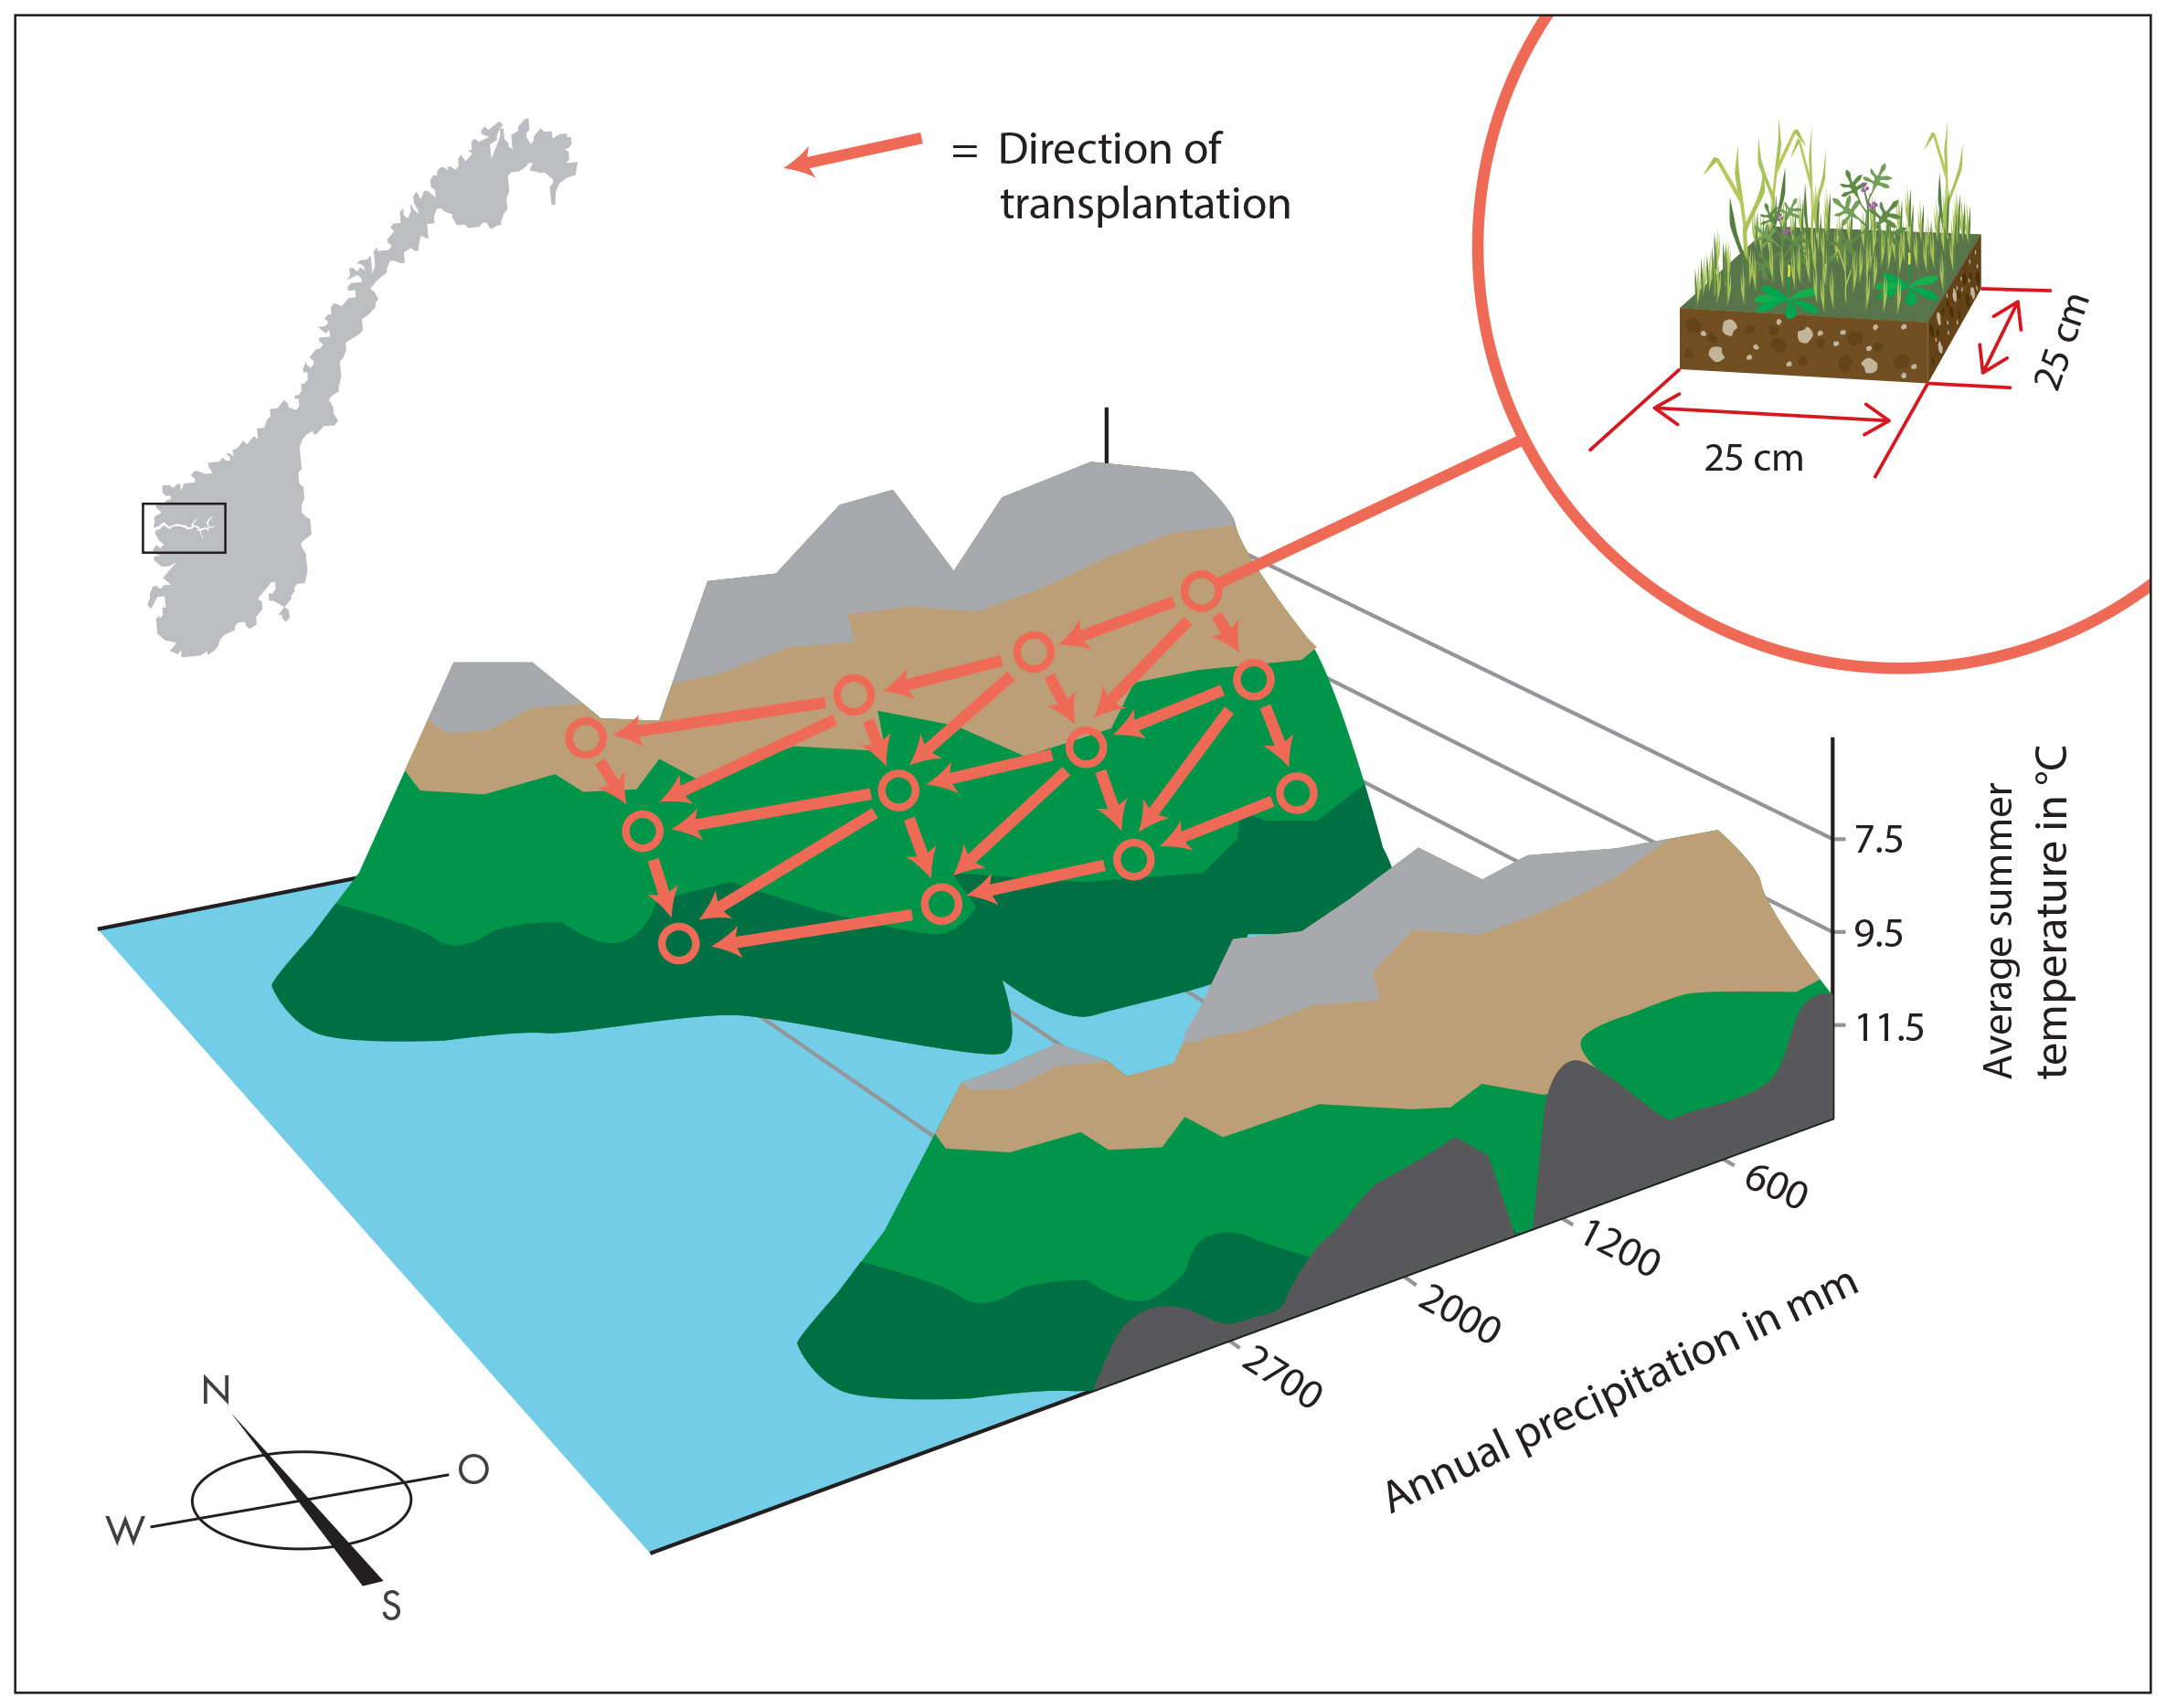
Biotic interactions are often ignored in assessments of climate change impacts. However, climate-related changes in species interactions, often mediated through increased dominance of certain species or functional groups, may have important implications for how species respond to climate warming and altered precipitation patterns. We examined how a dominant plant functional group affected the population dynamics of four co-occurring forb species by experimentally removing graminoids in semi-natural grasslands. Specifically, we explored how the interaction between dominants and subordinates varied with climate by replicating the removal experiment across a climate grid consisting of twelve field sites spanning broad-scale temperature and precipitation gradients in southern Norway. Biotic interactions affected population growth rates of all study species, and the net outcome of interactions between dominants and subordinates switched from facilitation to competition with increasing temperature along the temperature gradient. The impacts of competitive interactions on subordinates in the warmer sites could primarily be attributed to reduced plant survival. Whereas the response to dominant removal varied with temperature, there was no overall effect of precipitation on the balance between competition and facilitation. Our findings suggest that global warming may increase the relative importance of competitive interactions in semi-natural grasslands across a wide range of precipitation levels, thereby favouring highly competitive dominant species over subordinate species. As a result, semi-natural grasslands may become increasingly dependent on disturbance (i.e. traditional management such as grazing and mowing) to maintain viable populations of subordinate species and thereby biodiversity under future climates. Our study highlights the importance of population-level studies replicated under different climatic conditions for understanding the underlying mechanisms of climate change impacts on plants.

How to prepare a manuscript for publication?

If you are a scientist, you want to publish your work at some point. Other scientists in your field should read and learn from your work. And in science a publication is usually a paper in a journal. Publishing a paper can be hard work if you do it for the first time (also later), but you’ll learn and get better at it. The first step is to prepare a manuscript that you send to a journal. Here are some of my experiences, how to do it.

I am an ecologist and some things might only apply to this field, but I think most journals have a similar style and these ideas can be used everywhere.

Each journal will provide author guidelines. It is very important to read these very carefully before starting anything. The journals specify what type of articles they are interested in. Think carefully if your study fits into the journal. A good idea is to look at a recent issue to see what kind of articles there are. Some journals ask for an abstract before telling you if they want you to send in the full manuscript. Another important point to check is if you are ok with their conditions? For example, some journals want you to provide your data, or in some journals you have to pay for colour figures. Make sure you are aware of their requirements.

Content and structure

  • Language: most articles have to be written in English. If you are not a native English speaker it is a good idea to let a native speaker read your text or somebody with lot’s of experience.
  • Title: add a short and catchy title. It’s the first thing your reader will see!
  • Whatever you do, be consistent throughout the manuscript: use the same expressions for things and write in the same style.
  • The key words should be words not used in the title but important terms in the manuscript
  • Usually research articles follow this structure: title page, abstract, introduction, method and materials, results, discussion, acknowledgements, references, tables, figure captions.
  • What information is needed on the title page?
    • Title
    • Author names and their affiliation, email address
    • Running title: is an abbreviated title, which is usually printed at the top of the text pages and allows the reader to determine which paper they are looking at.
    • Corresponding author: is usually the author that is responsible for the correspondence throughout the publication process.

Formatting style

  • Use a recent paper as a template. Not to copy but as guidance.
  • Add line numbering: it’s easier for anybody reading your text to refer to a specific position in your text.
  • Double spacing makes the text more readable.
  • Do not justify the right margin. It is maybe not as aesthetically pleasing, but far more readable.
  • Add page numbers! Have you ever printed a 30-page text and then mixed the pages?
  • Keep to the word count or page allowance. If you don’t, it is very easy for the editor to reject your manuscript.
  • Check the requirements for figures and tables: quality of figures, where and how to place the legend, are coloured figures allowed or do you need to pay for it and how should you refer to them (Fig. 1a or Figure 1A). How do you submit figures and tables? Some journals want them in the text (e.g. one table per page), some want you to upload the figures separately.
  • How does the supplementary material need to be presented? In a separate file? And how should you refer to the supplement material (see Appendix Fig. S1)?
  • What format of your manuscript is allowed? Word, LaTex, PDF,…
  • Check your reference list very carefully! Number allowance, format, order. It is very easy to make mistakes here and not all programs provide correct references. Are the species names in italics? Usually there should not be Capital Letters in the Title unless it is a Location or a Name.

By following these instructions, it is not guaranteed that your paper gets accepted. But if you keep to “the code” the editor is more willing to have a real look at the content of your manuscript and not send it back right away.

Good luck preparing your first manuscript and let me know about your experiences.

Create a map in R

I belive that every ecological publication of a study needs a map. It does not necessarily need to be in the paper but at least in the appendix. I admit, I like maps and could look at maps for infinity, but maps also illustrate where a study was done, the scale of the study and where populations were collected, the range of the study species or locations of the study can be visualized.

Making maps is very easy with R. With a few lines of code you can produce a map of any region in the world and then plot points on the map.

Here, I produced a world map using the worldclim elevation data as background and plotted populations and study sites on the map. I used raster package, which is a powerful tool to process spatial data.

This is the R code I used for the map:

install.packages(„raster“)
library(raster)
climate <- getData(‚worldclim‘, var=’alt‘, res=2.5) # download elevation data from worldclim

plot(climate$alt, axes=FALSE, col = grey(0:100/100)) # plot world map
points(dat.pop$long.pop, dat.pop$lat.pop, col=“limegreen“, pch=16, cex=0.7) # plot populations
points(dat.site$longitude_site, dat.site$latitude_site, col=ifelse(dat.site$studysite==“Garden“,“firebrick1″, „gold1″), pch=ifelse(dat.site$studysite==“Garden“,0,2), cex=0.8) # plot sites
legend(„topleft“, c(„Study populations“, „Experimental gardens“, „Climate chamber and greenhouse experiments“), pch=c(16, 0,2), col=c(„limegreen“, „firebrick1“, „gold1″), bty=“n“)

Worldmap


Other powerful packages to draw maps are maps and mapdata. To plot maps there is a simple command „map“. And by adding a country or a list of countries only parts of the world are plotted.

library(maps); library(mapdata)
map(‚worldHires‘) # the world
map(‚worldHires‘,’Switzerland‘) # Switzerland
map(‚worldHires‘, c(‚Norway‘, ‚Sweden‘, ‚Finland‘,’Denmark‘, ‚Island‘), xlim=c(-11,50), ylim=c(45,90)) # Scandinavia


Switzerland

Application for a Landrover

This week two collegues and me applied for a landrover for the next field season. The grant is from the Royal Geographic Society: „The award is aimed at those who want to take a journey beyond their limits and boundaries, that offers chalenges for the team.“

To illustrate our motivation and that a good car is an essential part of our field work we created a video about our project.


Biotic vs. Abiotic Drivers of Local Plant Community

Biotic and abiotic factors are important drivers for species community composition. But how important are they along environmental gradients and between functional groups?

To answer this question, a study was conducted in the SeedClim grid in south-western Norway, consisting of a temperature and precipitation gradient. At each of the 12 sites, the vegetation as well as biotic and abiotic factors were assessed.

Both biotic and abiotic factors were important drivers, but explained the species composition at different ends of the gradient. The biotic factors tended to be more important at low elevation (competition), while the abiotic factors explained more at higher elevation (facilitation).

The study also found that graminoids thrive better in wetter climate compared to forbs. In the future with a warmer and wetter climate, graminoids might benefit and forbs could potentially decline due to competition from increasing abundances of graminoids.

The article was published in PlosOne in 2015 and the abstract and full article can be read here.


DSC_0254


SeedClim – large scale climate change experiment in the Western Norwegian Fjords


In many regions climate is predicted to become warmer and wetter, which will affect among others species composition, population dynamics and species interactions. SeedClim is a large scale experiment in the western Norwegian fjord landscape, designed to assess independent and joint effects of temperature and precipitation on grassland communities.

In 2009, 12 experimental grassland sites were established, in a climate grid where three levels of mean summer temperature (7.5, 9.5 and 11.5°C) were combined with four levels of mean annual precipitation (600, 1200, 200, 2700mm) levels. All other conditions, like bedrock type, slope and southward exposure were kept as constant as possible.

To simulate climate change, vegetation turfs (25 x 25 cm) were transplanted to warmer, wetter and warmer&wetter conditions. A whole summer was used to find the 12 sites, which was only the start of the logistic nightmare. Each plant on the turf was recorded, and then transported to the new location. Then the turfs were left on their own for more than a year to let the vegetation recover from the transplant. In summer 2011 the turfs were re-analysed.

Studying species composition was not the only purpose of SeedClim. Since 2009 numerous experiments and observational studies have been carried out including germination study, demography, removal experiments, biomass collection and studying the bryophyte community. In the last two years a couple of new projects have started:

  • FunCaB a study on the role of functional group interactions in mediating climate change impacts on the carbon dynamics and biodiversity of alpine ecosystems
  • studying the effect of climate change on phenology
  • Drive: the plant root microbiome diversitz and resilience in a changing climate


diagramm_2

Fig.1: Transplant design in SeedClim.


118

Fig. 2: One vegetation turf ready to be transplanted to a warmer or wetter site.


DSC_0124

Fig. 3: Skjellingahaugen, the coldest and wettest sites in the grid.